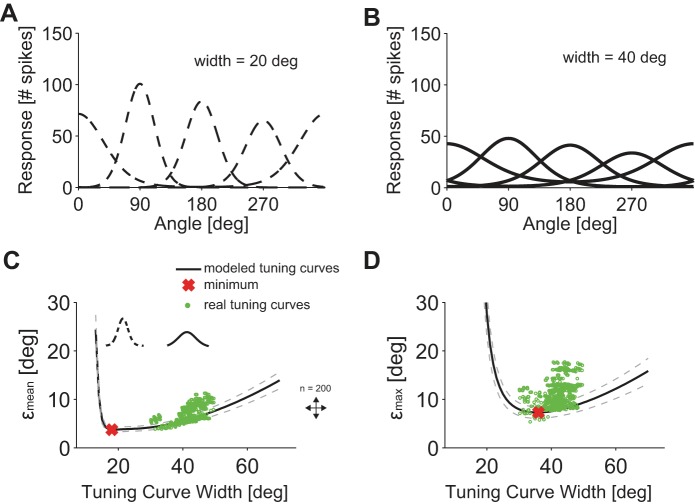
Fig. 7.
Influence of tuning curve width on decoding precision. A and B: 2 examples (solid and dashed lines, von Mises function) of 4 simulated tuning curves with preferred directions separated by 90° for 2 different widths of 40° and 20°. The integral of the tuning curves was fixed. C: εmean, computed with model tuning curves, as a function of the tuning curve width (solid line, mean; dashed line, SD). Red cross, lowest εmean value; green dots, εmean values for measured tuning curves (n = 600 quadruplets). D: εmax, computed with model tuning curves, as a function of tuning curve width (solid line, mean; dashed line, SD). Red cross, lowest εmax value; green dots, εmax values for measured tuning curves (n = 600, quadruplets).

