
Fig. 2.
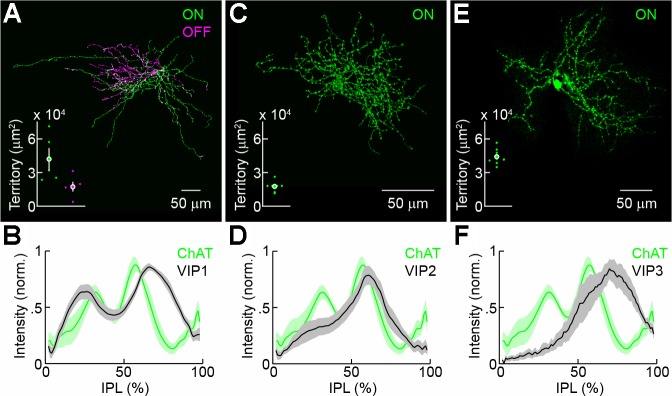
Morphology of VIP1-, VIP2-, and VIP3-ACs. A, C, and E: maximum intensity projections of confocal image stacks of representative VIP1- (A), VIP2- (C), and VIP3-ACs (E) labeled by Brainbow adeno-associated virus injection in VIP-ires-Cre mice (A and C) and dye infusion during patch-clamp recording (E). Neurites in the ON (OFF) sublamina are shown in green (magenta). Insets show territories covered by the respective arbors (VIP1-AC: n = 5, VIP2-AC: n = 7, VIP3-AC: n = 9). Each dot represents data from 1 cell, whereas filled circles (error bars) indicate the means (± SE) of the respective population. B, D, and F: intensity distributions of labeled VIP1- (B), VIP2- (D), and VIP3-ACs (F) across the depth of the inner plexiform layer (IPL; 0% = INL; 100% = GCL) are shown alongside the distribution of choline acetyltransferase (ChAT) staining. Lines (shaded area) indicate means (± SE) of the respective populations.