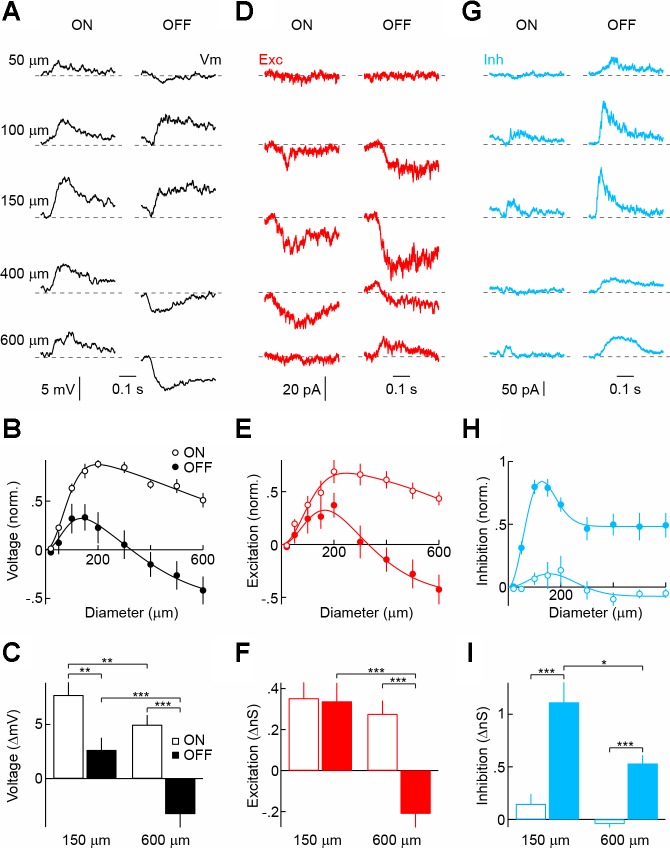
Fig. 3.
Light responses and synaptic inputs of VIP1-ACs. A, D, and G: representative voltage (A), excitatory postsynaptic current (EPSC; D), and inhibitory postsynaptic current (IPSC; G) responses to light (100% contrast, ON, left column) and dark (−100% contrast, OFF, right column) circles of increasing size (diameter noted in A) presented for 500 ms from a gray background. Traces begin at stimulus onset. Vm, membrane potential; Exc, excitatory; Inh, inhibitory. B, E, and H: summary data of ON (○) and OFF (●) sensitivity profiles of VIP1-ACs for voltage (B; n = 10), excitatory (E; n = 15), and inhibitory (H; n = 11) responses. Responses of each cell were normalized to their maximum. Difference-of-Gaussian fits are shown as solid lines (Enroth-Cugell and Robson 1966). C, F, and I: amplitudes of ON (open bars) and OFF (filled bars) voltage (C), excitatory (F), and inhibitory (I) responses to circles with a diameter of 150 and 600 μm. Bars (error bars) indicate means (± SE) of respective populations. *P < 0.05, **P < 0.01, and ***P < 0.001.

