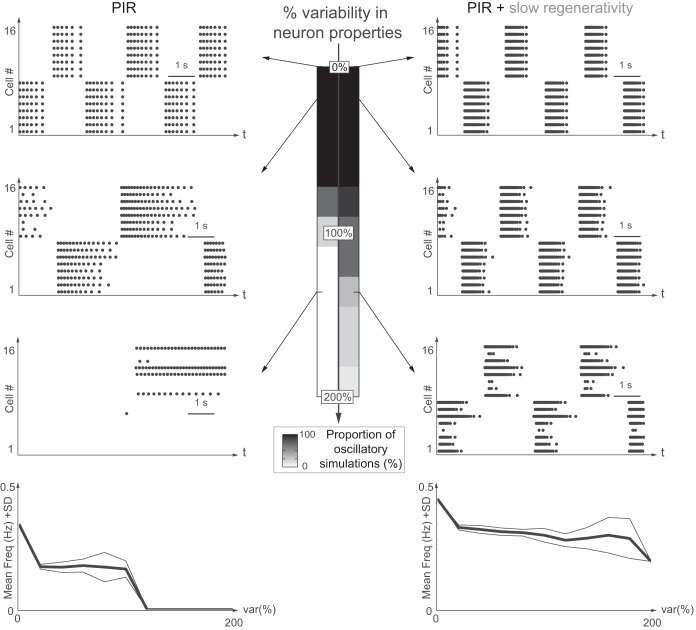
Fig. 5.
Slow regenerativity makes network oscillations insensitive to intrinsic variability. Network oscillations are robust toward intrinsic variability only with slow regenerativity. Left: PIR only. Right: PIR + slow regenerativity. Variability (level: 0 to 200%) is indicated in the maximal conductance of the PIR current, ḡPIR. The grayscale code indicates the proportion of simulations with stable rhythmic activity out of 10 simulations. From upper to lower, raster plots show 0, 20, and 140% variability, respectively. Bottom: plots of the mean frequency (mean freq.; bold line) and 1 standard deviation (SD) variation (thin lines) for each variability level (var%) for the 10 simulations with oscillations.

