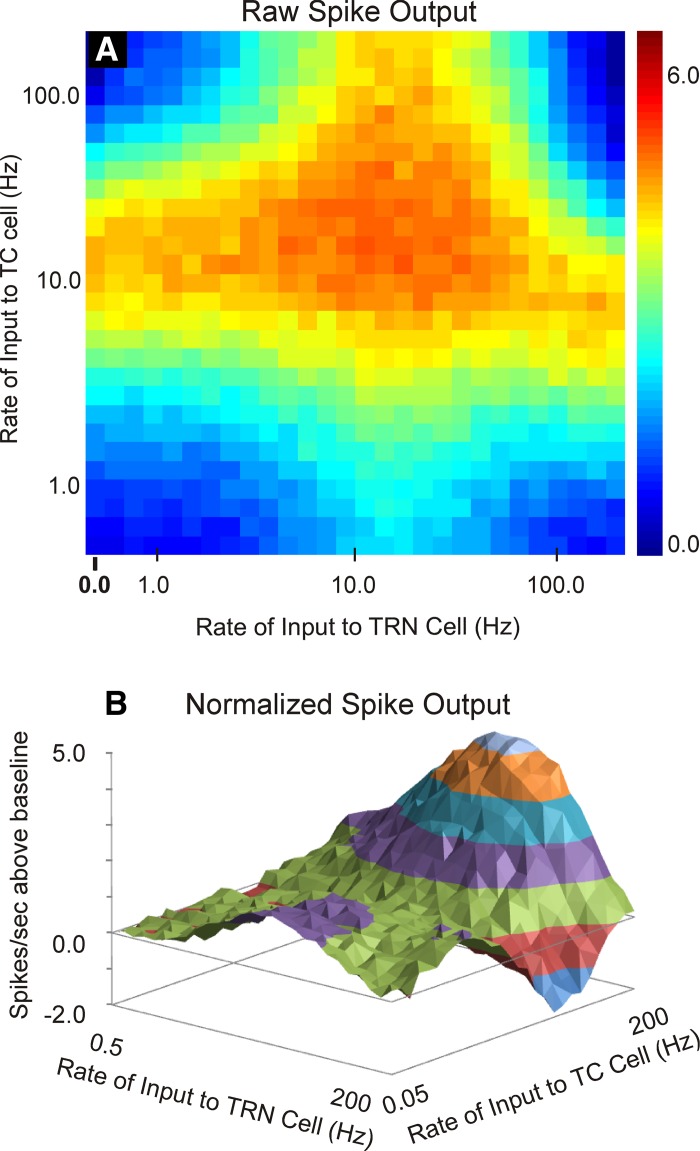
Fig. 6.
Output of L4 cell in response to a range of combinations of inputs to TC and TRN cells ranging from 0.5 Hz to 200 Hz, using the averaged parameters shown in Table 2. A: heat map of the raw spike output in the L4 cell. B: 3-dimensional contour plot of the difference of spike output relative to the baseline case of no input to the TRN in the L4 cell.

