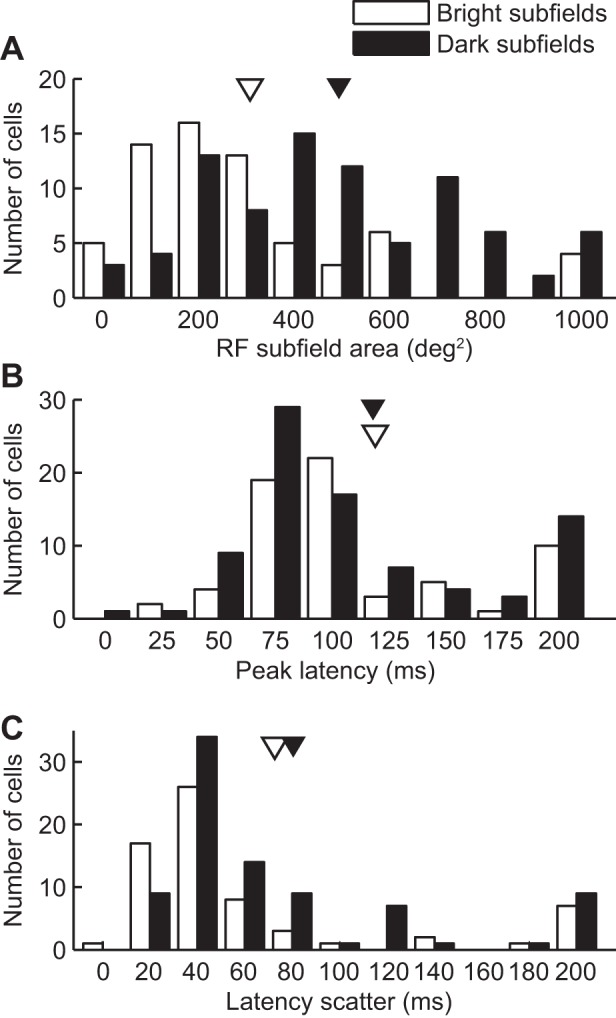
Fig. 2.

Basic spatial and temporal features of LP neuron RFs. Distribution histograms of basic RF features for bright (open bars) and dark (filled bars) subfields. Means are indicated by arrowheads. A: distribution histogram of RF subfield sizes. Note that the dark subfield size distribution is shifted to higher surface values (mean in deg2 for bright subfields: 314 ± 35 and for dark subfields: 511 ± 38). B: distribution histogram of the prespike time associated with the maximal spike probability (peak latency). Mean peak latency was 119 ± 6 ms and was not found to differ between bright and dark subfields (bright: 119 ± 9, n = 66, dark: 118 ± 8, n = 85, P > 0.05 Wilcoxon rank sum test). C: distribution histogram of the time duration during which spike probability was above chance levels (latency scatter). A small, yet significant, increase in latency scatter was observed for dark subfields (bright: 73 ± 12 ms, dark: 81 ± 8 ms, P < 0.01 Wilcoxon rank sum test).
