
Fig. 4.
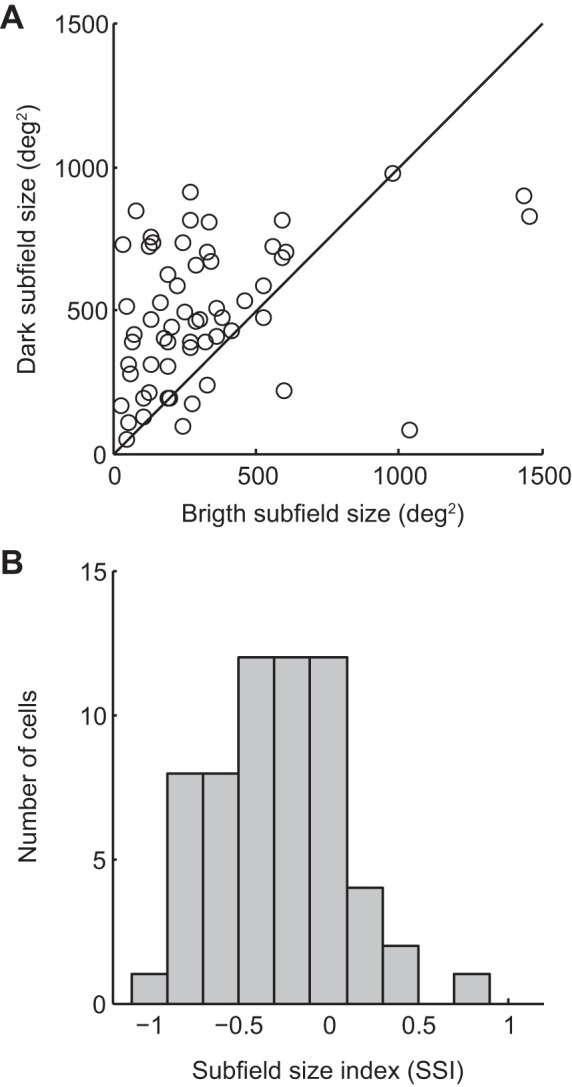
Differences in subfield size from neurons with polarity-opposed subfields. A: scatter plot of subfield size from paired bright and dark subfields. Note the higher proportion of points that lie above the line of unity, indicating a bias toward larger dark subfield sizes. B: distribution histogram of the subfield size index (see methods), a normalized index where negative values are associated with a larger dark subfield size. Distribution mean of −0.26 ± 0.05, P < 0.001 1-sample t-test, n = 60.