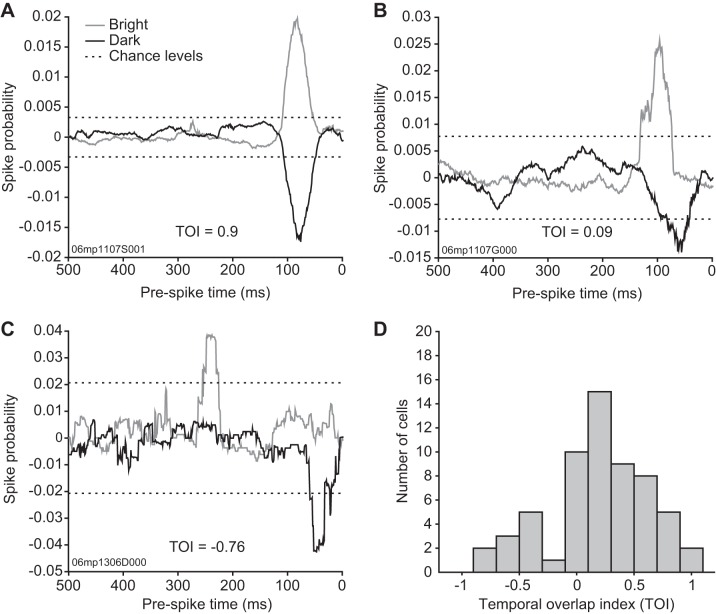
Fig. 7.
Subfield temporal profile concurrence of LP neurons with polarity-opposed subfields. To quantify the degree of synchronicity between bright and dark subfield spike probability latency profiles, a temporal overlap index (TOI, see methods) was computed. Negative values indicate time-segregated subfield spike latency profiles, whereas a value of 1 would indicate perfect synchrony between bright and dark subfield profiles. A–C: examples of temporal profiles obtained from LP neurons with polarity-opposed subfields where spike probability is plotted as a function of prespike time. Bright subfield spike probability is plotted in gray, whereas dark subfield is plotted in dark and, by convention, given negative values. Dotted lines indicate the spike probability levels expected by chance. Individual TOI values are indicated in the graphs. A: spike probability timecourse from a neuron with concurrent subfield spike latencies. B: spike probability timecourse from a neuron with subfield spike latencies that partially overlap. C: spike probability timecourse from a neuron with time-segregated subfield spike latencies. D: histogram of the TOI. Note the distinct distribution peak in negative TOI values (15/60 cells had negative TOI values).

