
Fig. 8.
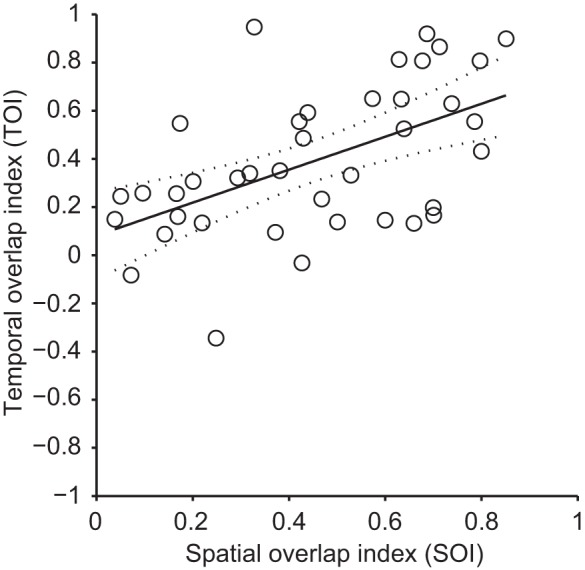
Correlation between spatial and temporal overlap indexes from neurons with polarity-opposed subfields. TOI values were plotted against spatial overlap index (SOI) values and subject to linear regression analysis. A correlation with a determination coefficient of 0.29 (P < 0.001, F-test) was found between SOI and TOI. Solid line represents the linear regression, and the dotted lines represent the 95% confidence interval of the regression.