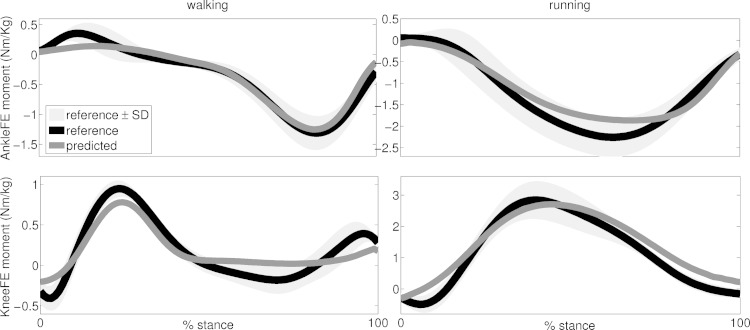
Fig. 5.
Predicted and experimental joint moments from all validation trials and subjects. The ensemble average (continuous lines) curves are depicted for experimental and predicted joint moments. The standard deviations (shaded area) are also depicted for the experimental joint moments. Experimental and predicted joint moments are reported about two degrees of freedom including knee flexion-extension (KneeFE) and ankle plantar-dorsi flexion (AnkleFE). The reported data are from the stance phase with 0% being heel-strike and 100% being toe-off events.

