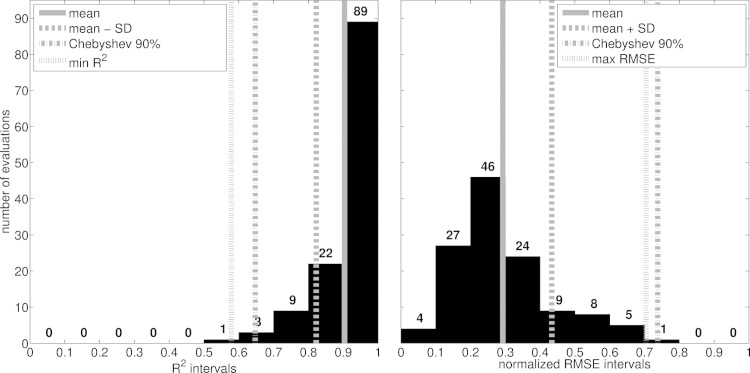
Fig. 6.
Distribution of the similarity indexes computed between experimental and predicted joint moments from all validation trials and subjects. Similarity indexes include the coefficient of determination (R2) and the root mean square error normalized to the root mean square sum of the experimental joint moments (RMSE). Histograms gather the R2 and RMSE values in intervals with a 0.1-fixed-width in the (zero-to-1) range. In this range, vertical lines highlight a number of variables including the average indexes (i.e., mean) and those within one standard deviation (i.e., SD), the maximum expected RMSE and the minimum expected R2 calculated using the Chebyshev's theorem assuming a 90% confidence interval (i.e., Chebyshev 90%), as well as the most unfavorable index values including R2 = 0.58 (i.e., min R2) and RMSE = 0.704 (i.e., max RMSE).

