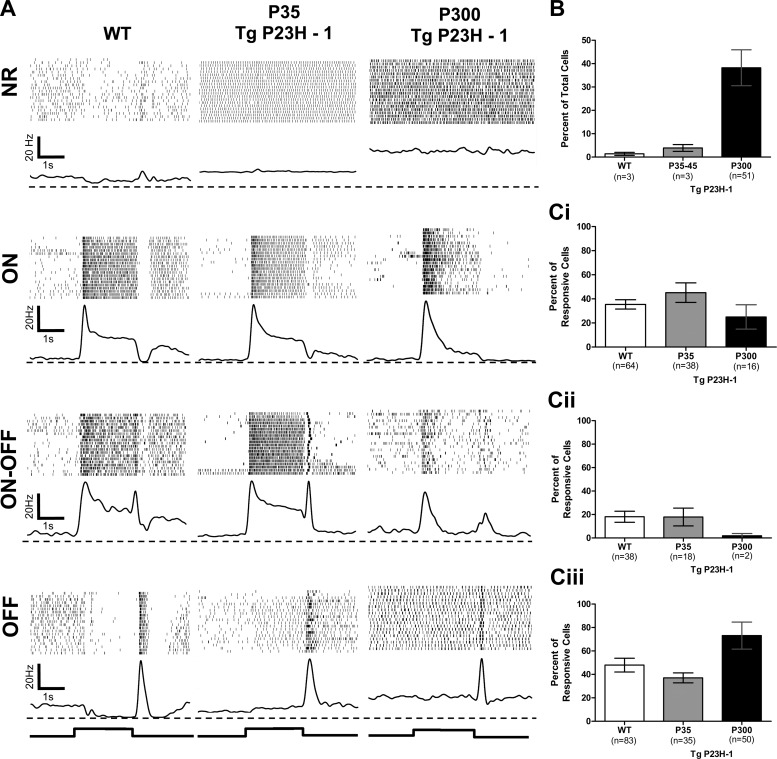
Fig. 1.
The distribution of retinal ganglion cell (RGC) classes is similar in wild-type (WT) and postnatal day 35–45 (P35-45) transgenic (Tg) P23H-1 rat RGCs, but both are significantly different from that in P300 Tg P23H-1 rat RGCs. A: representative responses from WT, P35, and P300 Tg P23H-1 RGCs to a 2-s full-field stimulus (750 cd/m2). Each line in the raster represents an individual trial, and each poststimulus time histogram (PSTH) is the average response for that RGC. The dashed line represents the zero point for the PSTHs. The onset and offset of the stimulus are indicated below the PSTHs. B: histogram of the percentage of nonresponsive (NR) RGCs for WT, P35, and P300 Tg P23H-1 rats. C: histograms of the percentage of each RGC class (ON, i; ON-OFF, ii; OFF, iii) in WT and Tg P23H-1 at P35 and at P300. The means represent the average across animals. The n value for each column indicates the total number of RGCs in each class for each group. A χ2 analysis shows that the distribution of functional RGC classes is similar between WT and P35 Tg P23H-1 RGCs, but the distribution for P300 Tg P23H-1 RGCs is significantly different from both (P < 0.0001 for both).

