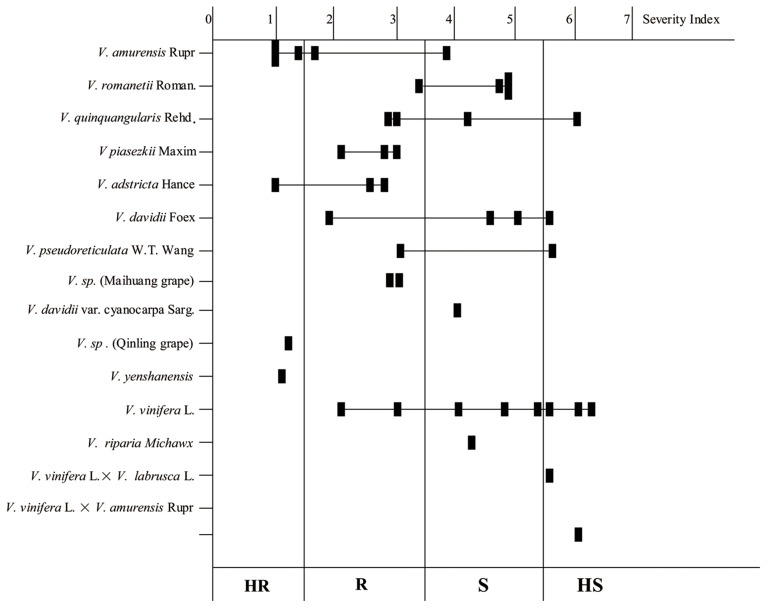
Figure 1.
Histogram showing the resistance levels of the 41 tested Vitis genotypes to B. cinerea. Solid squares represent the average of the severity index. HR, Highly Resistant (Scores: 0–1.5); R, Moderately Resistant (Scores: 1.51–3.5); S, Moderately Susceptible (Scores: 3.51–5.5); HS, Highly Susceptible to (Scores: 5.51–7.0).

