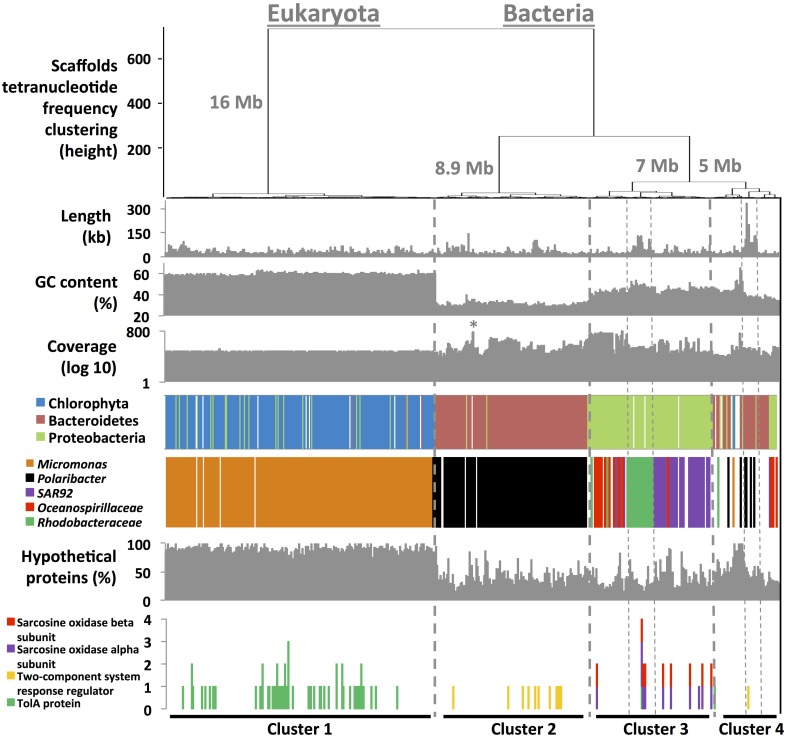
Figure 1.
Hierarchical clustering (Euclidean distance metric) of 1500 scaffolds (11.9–332.7 kb in length) based on their tetranucleotide frequency profiles. Seven informative layers were added below to the clustering tree. Percentage of hypothetical proteins and the occurrence of specific functions were accessed using RAST (Aziz et al., 2008). Taxonomical affiliation was inferred using phymmBL (Brady and Salzberg, 2009). The * in coverage value layer represents Phaeocystis antarctica chloroplast scaffolds.

