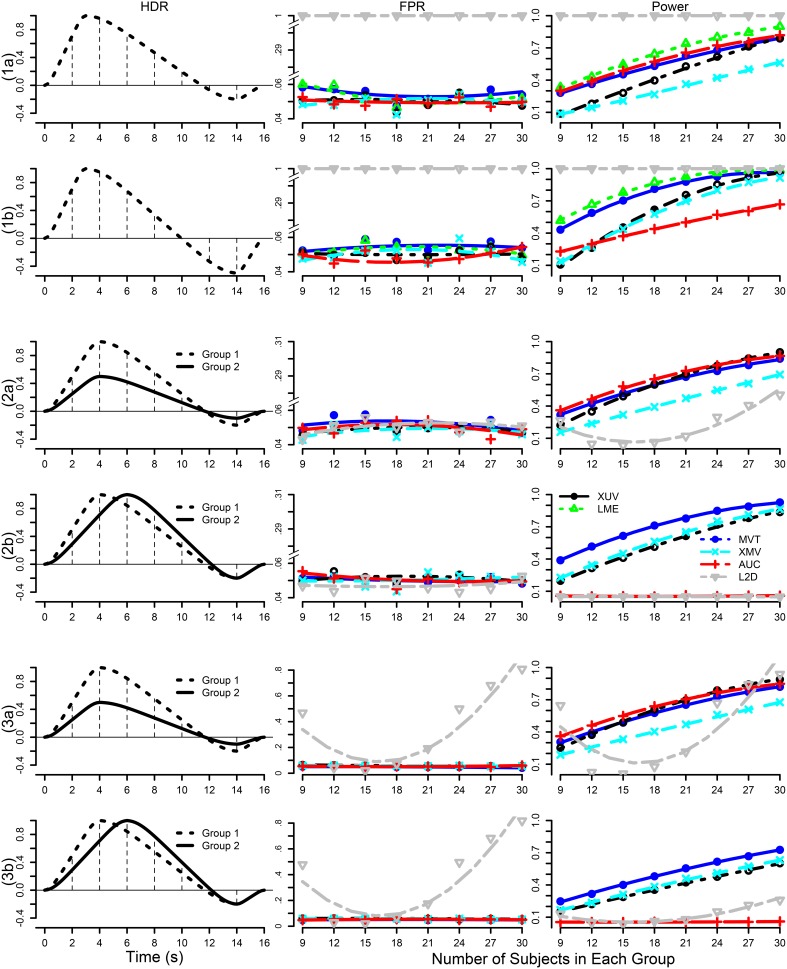
Figure 1.
Simulation parameters and results. The six rows correspond to the scenarios in which the presumed HDRs (first column) with a poststimulus undershoot were generated by the convolution program waver in AFNI, and sampled at TR = 2 s (shown with vertical dotted lines): (1) one group with a small (1a, σ = 1.8) and a moderate (1b, σ = 1.8) undershoot, (2) two homoscedastic groups with the same HDR shape but different amplitudes (2a, σ = 0.5) and with same peak amplitude but a difference of two seconds in peak location (2b, σ = 0.3), (3) two heteroscedastic groups with the same HDR shape but different amplitudes (3a, σ = 0.3) and with same peak amplitude but a difference of two seconds in peak location (3b, σ = 0.3). FPR and power are shown in the second and third columns with a varying number of subjects in each group at a temporal correlation coefficient ρ of 0.3 under six testing approaches: XUV, LME, MVT, XMV, AUC, and L2D. The curves for FPR and power were fitted to the simulation results (plotting symbols) through LOESS smoothing with second order local polynomials.

