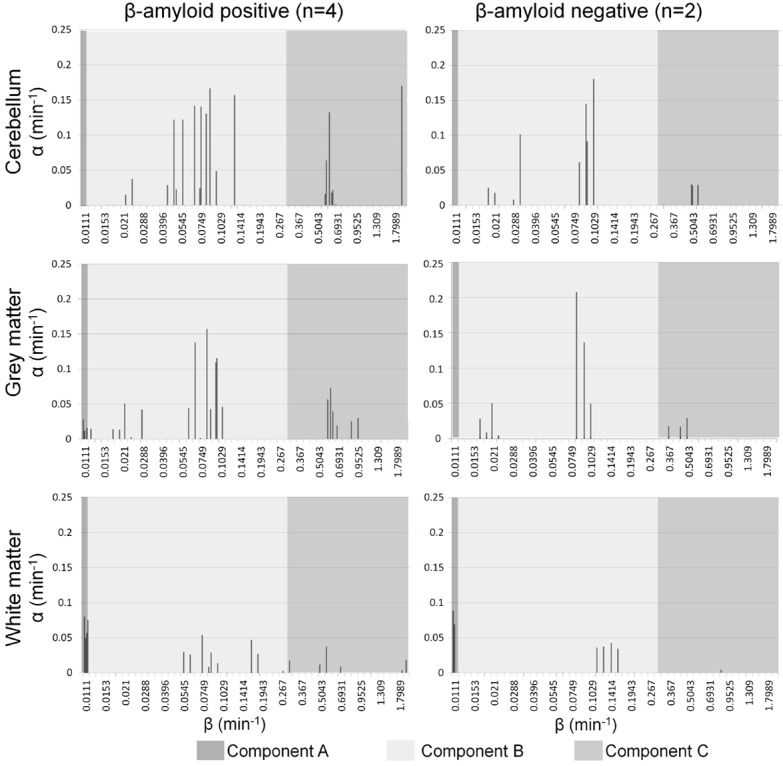
Figure 1.

Spectral analysis peaks of (from top to bottom) 18F-flutemetamol uptake in cerebellar cortex, total grey and total white matter. Left column: the combined peaks of four subjects with positive uptake profile, right: the combined peaks of two subjects with negative uptake profile. The dark grey boxes on the left of each graph represent the range of peaks included in the slow component A (β≤0.0111 min-1), the light grey boxes show the intermediate range B (β: 0.0124-0.1748 min-1), and the grey on the right of each graph represent the fast component range C (β: 0.267-2 min-1). The slow component is completely absent in cerebellar cortex, and in the grey matter of negative subjects, while present in the grey matter of positive subjects and dominating in the white matter of both positive and negative subjects.
