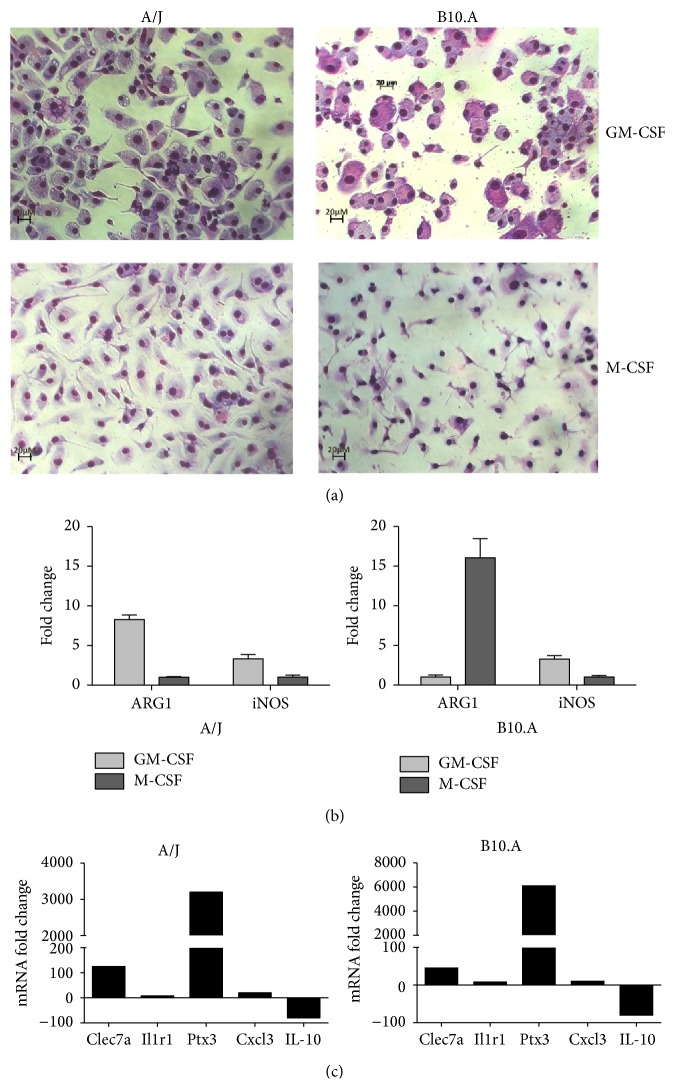
Figure 1.
Characterization of GM-BMM and M-BMM of A/J and B10.A mice. Murine bone marrow cells were differentiated into macrophages (BMM) in the presence of GM-CSF (GM-BMM) or M-CSF (M-BMM) as described in Section 2. (a) Photomicrography of GM-BMM and M-BMM from A/J and B10.A mouse strains stained with Panotic kit (×200). (b) Quantitative PCR analysis (qRT-PCR) of induced nitric oxide synthase (iNOS) or Arginase-1 (ARG-1) mRNA expression from GM-BMM or M-BMM. Bars with SD represent the mean of fold change of the gene expression and are shown as n-fold difference of GM-BMM to the M-BMM cells. Fold change values were determined after each gene was normalized to the constitutively expressed rps9 gene. Data is representative of three separate experiments. (c) qRT-PCR analysis of Clec7a, Ilr1, Ptx3, Cxcl3, or Il10 mRNA expression from GM-BMM or M-BMM. Bars represent the mean of fold gene expression and are shown as n-fold difference of GM-BMM to the M-BMM cells. Fold change values were determined after each gene was normalized to the constitutively expressed Gusb (A/J) and B2m (B10.A) genes using the comparative threshold method.

