Figure 3.

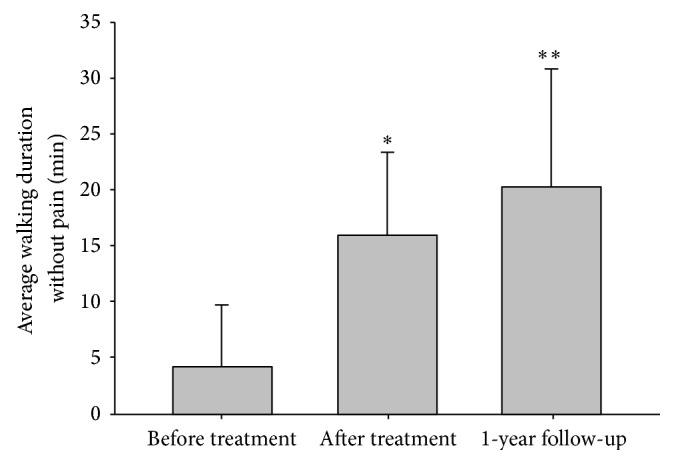
Walking duration without pain. ∗: Wilcoxon signed-rank test of the before and after treatment values, p < 0.05; ∗∗: t-test of the before treatment and after one year of follow-up values, p < 0.05.

Walking duration without pain. ∗: Wilcoxon signed-rank test of the before and after treatment values, p < 0.05; ∗∗: t-test of the before treatment and after one year of follow-up values, p < 0.05.