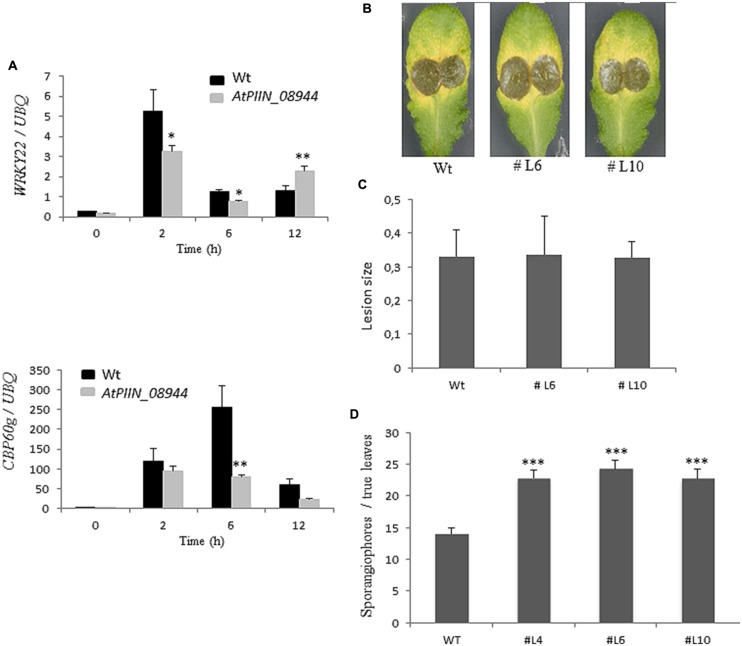
FIGURE 3.
Assessment of the immune status of AtPIIN_08944OE plants. (A) Two-week-old AtPIIN_08944OE and the respective wt plants were treated with 100 nM flg22 in six well plates. RNA was extracted at 0 (untreated control), 2, 6, and 12 hpt and qPCR was performed. Suppression of flg22-induced transcription was observed for AtWRKY22 and CBP60g. Arabidopsis UBQ-4 was used for normalization. Values are means ± SE of two independent experiments. (B) Detached leaves of four to 6-week-old AtPIIN_08944OE (lines #L6, #L10) and the respective wt plants were inoculated with conidia of Botrytis cinerea. Photographs were taken 5 dpi. (C) Average lesion size of AtPIIN_08944OE (lines #L6 and #L10) and the wt plants after inoculation with B. cinerea. Averages were calculated from 10 to 15 leaves per line. Values are means ± SE of three independent experiments. (D) Two-week-old AtPIIN_08944OE seedlings (lines #4 #L6 #L10) and wt plants were sprayed with spores of Hyaloperonospora arabidopsidis and sporangiophores development on true leaves determined 4 dpi. For each line at least 100 plants were analyzed. Values are means ± SE of two independent experiments. Asterisks indicate significant differences at ∗P < 0.05, ∗∗P < 0.01, ∗∗∗P < 0.001 as analyzed by student’s t-test.

