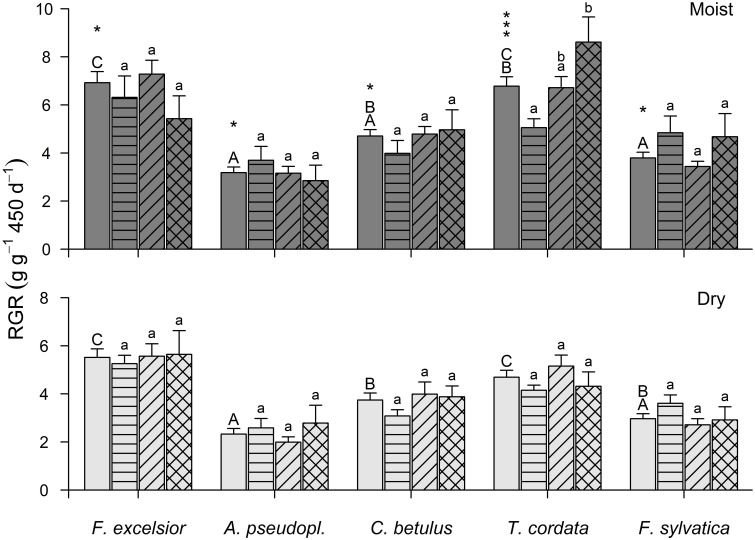
Figure 3.
Relative growth rate (above- and below-ground) of the five species in the moist (upper panel) and dry treatment (lower panel) in monoculture (second bar of a group), 3-species mixture (3rd bar), 5-species mixture (4th bar), and as average of all constellations (first bar, no hatching) (means ± SE). Different capital letters indicate significantly different species averages (p < 0.05), different small letters significant differences between the three diversity levels within a species. The number of asterisks gives the level of significance for the growth reduction from the moist to the dry treatment of a species (*p < 0.05; ***p < 0.001).

