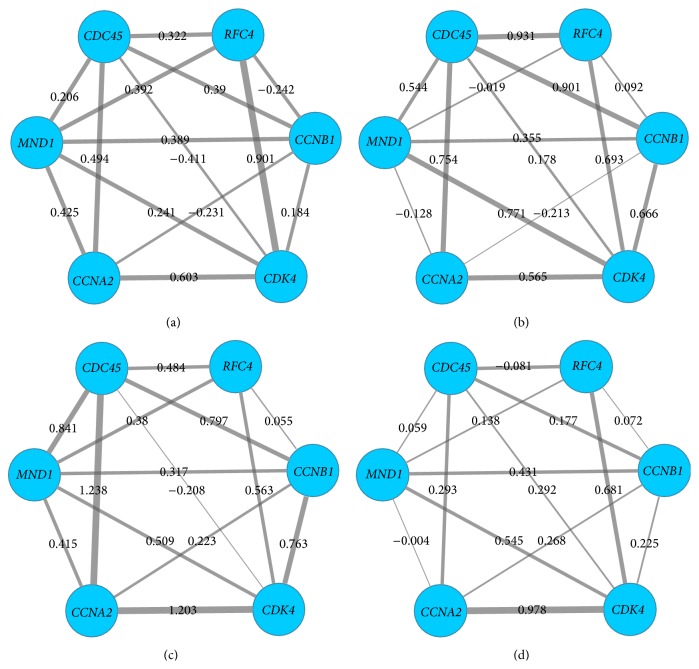
Figure 6.
Swapping behavior in altered module (CCNA2, CDK4, CDC45, RFC4, CCNB1, and MND1). Nodes stood for genes, and edges stood for the interactions of genes. The thickness of the edges represented the interaction scores or expression levels between two genes in the module, more thickness with higher value of expression scores. (a) represents stage I of ccRCC, (b) represents stage II, (c) represents stage III, and (d) represents stage IV.

