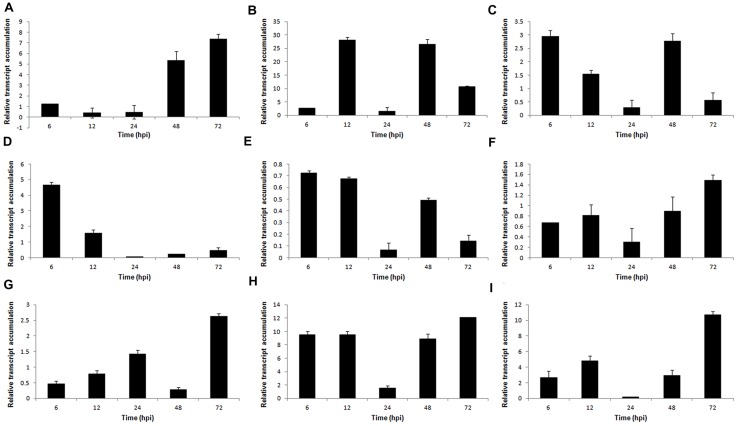
FIGURE 3.
Gene expression profiles of S. sclerotiorum during infection to P. vulgaris. Expression analyses using RT-qPCR were performed and transcript levels were calculated in triplicate using a comparative method. GPDH gene was used as the reference gene in S. sclerotiorum and a health plant as the reference sample. Tissue samples were collected at 6, 12, 24, 48, and 72 hpi. Results are reported as means ± standard deviation (SD) of three samples for each treatment. (A) Sspg1. (B) Sspg3. (C) Sspg6. (D) β-1,3-glucosidase. (E) β-xylosidase. (F) β-1,4-glucanase. (G) cellobiohydrolase. (H) acp1 (acid protease). (I) aspS (aspartyl protease).

