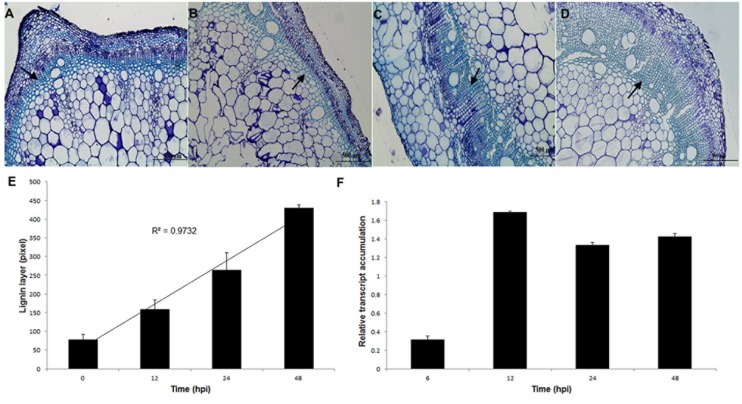
FIGURE 8.
Thickening layers of lignin in P. vulgaris stems in response to S. sclerotiorum infection. (A) Without infection. (B) 12 hpi. (C) 24 hpi. (D) 48 hpi. Bar = 500 μm. (E) Thickness of lignin layer (arrows) measured using Leica LAS EZ V3.0.0 software (Leica Application Suite, Leica Microsystems, Switzerland). (F) Relative transcript accumulation of Pvcallose gene. Expression analyses using RT-qPCR were performed and transcript levels were calculated in triplicate using a comparative method. Actin-11 gene was used as the reference gene in P. vulgaris and a health plant as the reference sample. Results are reported as means ± standard deviation of three experiments.

