Figure 3.
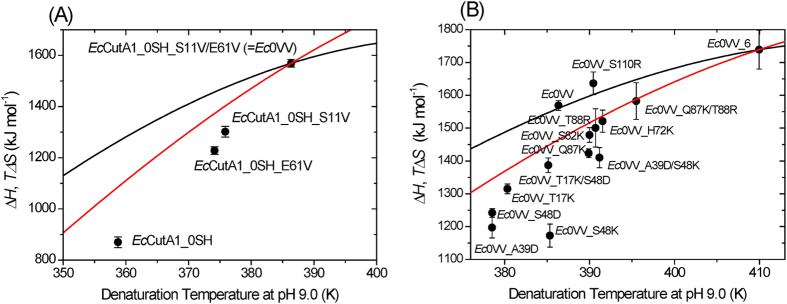
(A) Temperature dependence of ΔH for hydrophobic EcCutA1 mutants at pH 9.0. ΔH values (closed circles) of denaturation for EcCutA1_0SH, EcCutA1_0SH_S11V, EcCutA1_0SH_E61V, and Ec0VV come from Table 1. The black curves represent the temperature function of ΔH upon denaturation using the temperature function of ΔCp for Ec0VV obtained from Y3 of Supplementary Fig. 4A. The red curve represents TΔS of Ec0VV. In the case of Ec0VV, the parameters A, B, and C of ΔCp (in kJ mol−1 K−1) in equation (1) were calculated to be 7.61029, −0.26614, and −8.4434 × 10⁻⁴, respectively. (B) Temperature dependence of ΔH for ionic Ec0VV mutants at pH 9.0. ΔH values (closed circles) of denaturation for EcCutA1 mutants come from Table 1. Black curves represent the temperature function of ΔH upon denaturation, using the temperature function of ΔCp for Ec0VV_6 obtained from Y3 of Supplementary Fig. 4B. The red curve represents TΔS of Ec0VV_6. In the case of Ec0VV_6, the parameters A, B, and C of ΔCp (in kJ mol−1 K−1) in equation (1) were calculated to be 4.22658, −0.29835, and −10.0757 × 10⁻⁴, respectively.

