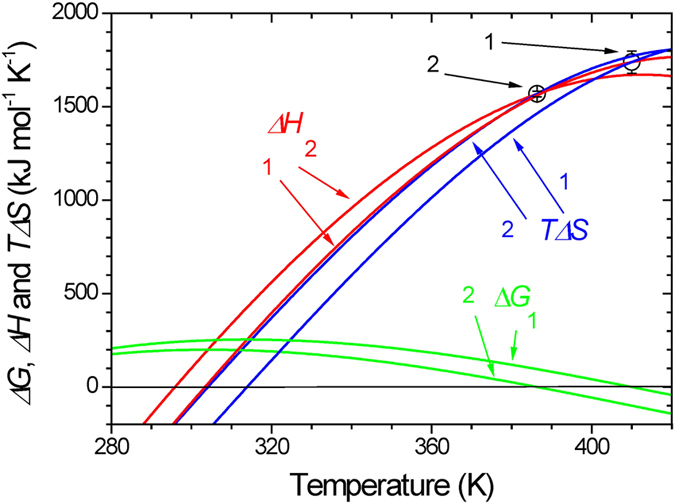
Figure 4. Temperature functions of ΔG, ΔH, and TΔS for Ec0VV, and Ec0VV_6 between 280 and 420 K.

Temperature functions of ΔH and ΔS were obtained using equations (2) and (3), respectively, in which each temperature function of ΔCp was used for the calculation of Ec0VV and Ec0VV_6. The green, red, and blue curves represent values of ΔG(=ΔH–TΔS), ΔH, and TΔS, respectively. Numbers 1 and 2 represent Ec0VV_6 and Ec0VV, respectively. Open circles with error bars show the ΔH value of each protein at the denaturation temperature, as indicated in the figure.
