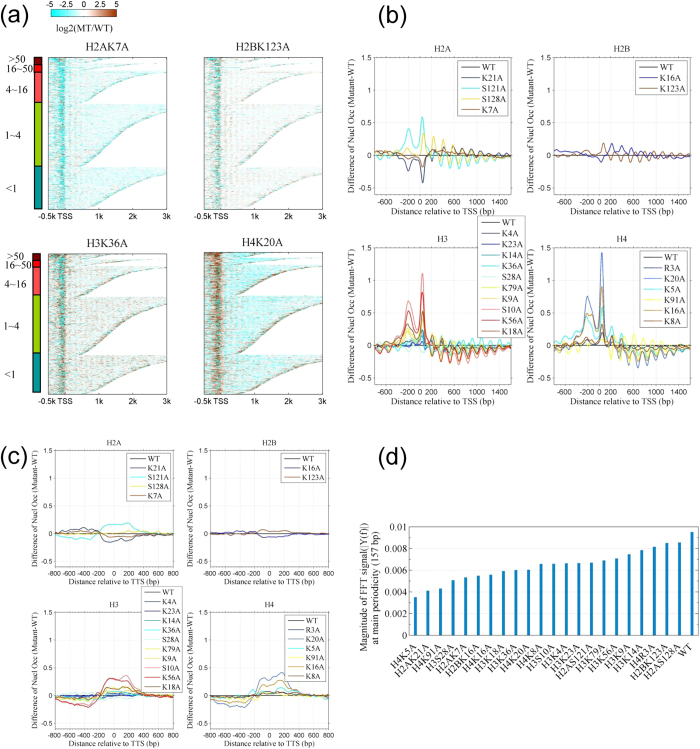
Figure 2. The first nucleosomes upstream (−1) and downstream (+1) of a transcription start site (TSS) are dynamic in histone mutants.
(a) Heat maps showing the log2 fold changes in nucleosome occupancy in the histone mutant strains relative to the wild-type strain for 5,419 genes. Data were aligned according to the TSS and grouped by transcription rate (rate < 1, 1 to <4, 4 to <16, 16 to <50, and ≥ 50; within each group, the genes were sorted by length). Data from mutants H2AK7A, H2BK123A, H3K36A, and H4K20A are shown. Nucleosome occupancy profiles are shown in Fig. S5a. (b) Differences in nucleosome occupancy around the TSS between mutant and wild-type strains. Each profile represents the average difference in occupancy between the mutant and the wild-type strain for 5,419 genes. The variation of dyad position and occupancy is shown in Fig. S4a. The significance of differences in occupancy is given in Fig. S4b. (c) Differences in nucleosome occupancy around the transcription termination sites between mutant and wild-type strains (analysis as for Fig. 2b; see also Fig. S4b). (d) Histone mutations disrupt the periodicity of the nucleosome distribution. The bar plot shows the intensities of Fourier spectra (see Fig. S6) of the distributions of nucleosomes with a periodicity of 157 bp, where the Fourier spectra highly peak, in the 22 mutants and the wild-type strains. The periodicity was calculated using the autocorrelation signal of the nucleosome occupancy profile of 16 chromosomes.

