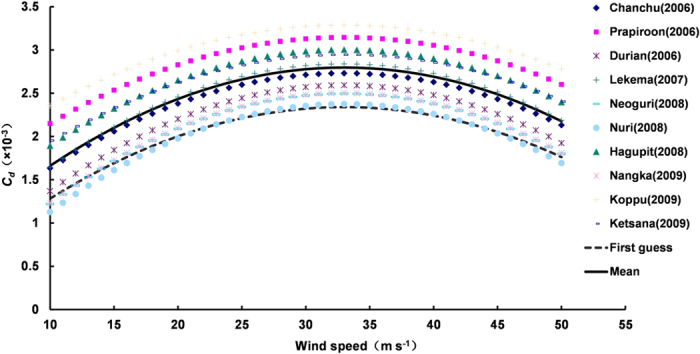
Figure 2. The parabolic model of Cd as a function of 10 m wind speed (Unit: m s−1) optimized for each of TC Cases I.

The black dashed and solid lines represent the first guess and the mean, respectively.

The black dashed and solid lines represent the first guess and the mean, respectively.