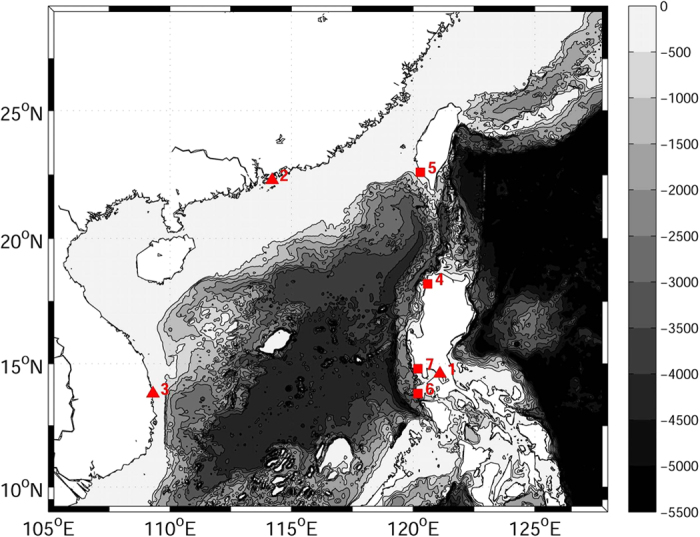
Figure 3. Map of the bathymetry (Unit: m) of the model domain with locations of water level stations.

Triangle indicates the station used for Cd optimization, while square indicates the station used for validation. The model domain covers most of the South China Sea (SCS) and part of the northern West Pacific. (The figure is plotted by MATLAB software with M_Map package).
