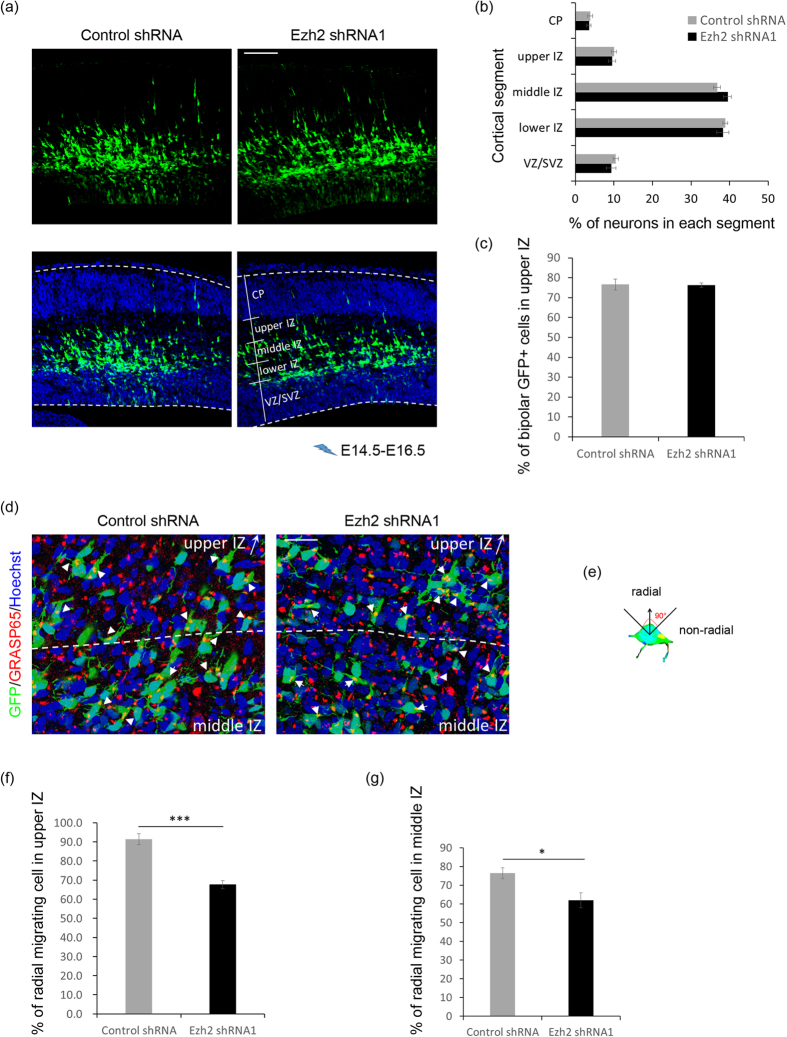
Figure 3. Ezh2 knockdown affects neuronal orientation.
(a) Representative images showing the E14.5 mouse cortices electroporated with indicated plasmids and examined at E16.5. Scale bar: 100 μm. (b) Frequency distribution and quantification of GFP+ cells in different layers. n = 6 for each group. Data represent mean ± SEM. (c) Statistical analysis showing percentage of bipolar cells in upper IZ. n = 6 for each group. Data represent mean ± SEM. (d) Representative images showing the Golgi localization of electroporated neurons in the IZ (white arrows). Scale bar: 25 μm. (e) Scheme for the definition of radial and non-radial migrating cell by the location of Golgi apparatus (yellow). Black arrow points to the pial surface. (f,g) Statistical analysis showing percentage of radial migrating cells in each region. n = 6 for each group. Data represent mean ± SEM. Student’s t - test; *p < 0.05; ***p < 0.001.

