
FIG 3 .
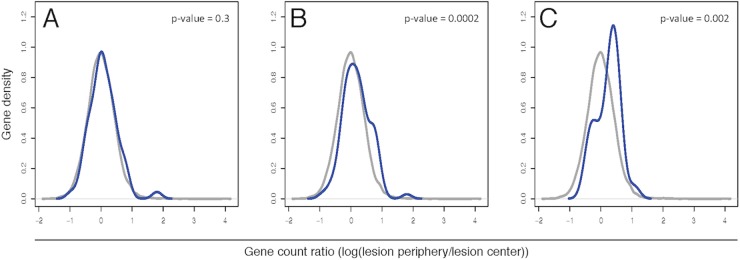
Density curves of defined gene sets compared to the entire transcriptome. Gene sets were compiled to represent the general cell migration (A), leukocyte migration (B), and apoptosis (C) pathways. Using the log ratio of RNA-seq reads in the lesion periphery compared to the lesion center, log ratios of each of these compiled gene sets (blue lines) were contrasted against the entire transcriptome (gray lines) using a Wilcoxon rank-sum test. The y-axis values are arbitrary units as calculated by Gaussian kernel density estimates. Only genes with >3 reads from the RNA-seq analysis were graphed.