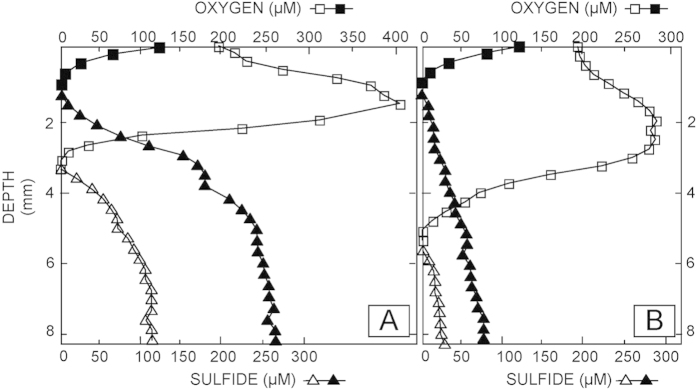
Figure 3. In situ depth profiles of oxygen and sulfide concentrations in Shark Bay microbial mats.
Oxygen and sulfide concentrations were measured during peak photosynthesis between noon and 2:00pm (open symbols) and the end of the night, between 4:00 and 5:00am (closed/filled symbols). Oxygen and sulfide electrodes were deployed within 1.5 mm from each other. Multiple profiles (n = 3–7) were measured and representative profiles are shown. Squares represent oxygen, triangles sulfide concentrations. (A) Smooth mat. The oxygen concentration peaks at the subsurface layer of smooth mats during daytime (1–2 mm), but is zero below 4 mm. The sulfide concentration increases from 3 mm to 8 mm, with lower concentration during the day compared to night. (B) Pustular mat. The maximum oxygen concentration is found at the subsurface layer of pustular mats during daytime (1–2 mm). Permanent anoxic conditions prevail below 5 mm. The sulfide concentration is first observed at 5 mm, increases with increasing depth and has a lower concentration during the day compared to night.

