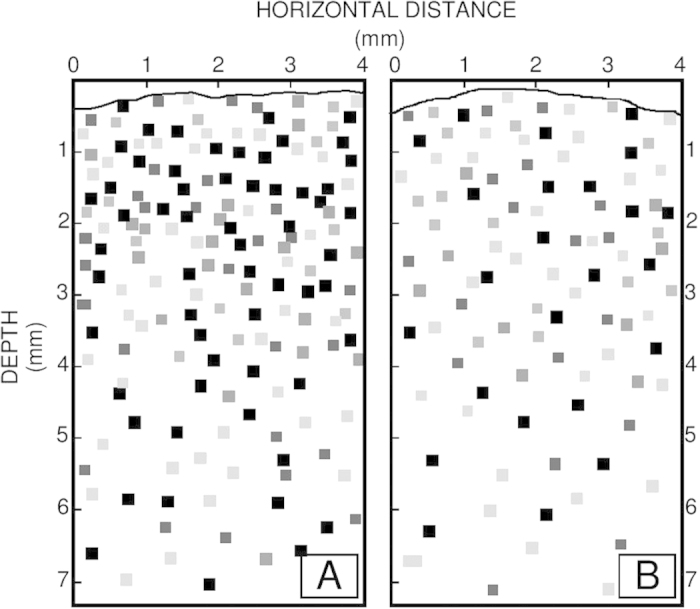
Figure 5. Two-dimensional distribution of sulfate reduction in Shark Bay mats visualized using the silver foil technique.

Trace near the top of the panels indicates the surface of the mats. Pixels indicate hotspots of sulfate reduction; darker pixels represent higher rates. (A) Smooth mat, showing high rates, especially close to the surface of the mat, coinciding with the zone of supersaturated [O2]. (B) Pustular mat, displaying a more diffuse pixel pattern, i.e., lower rates and a sulfate reduction distribution pattern that is less concentrated in the oxic zone than was found in the smooth mat.
