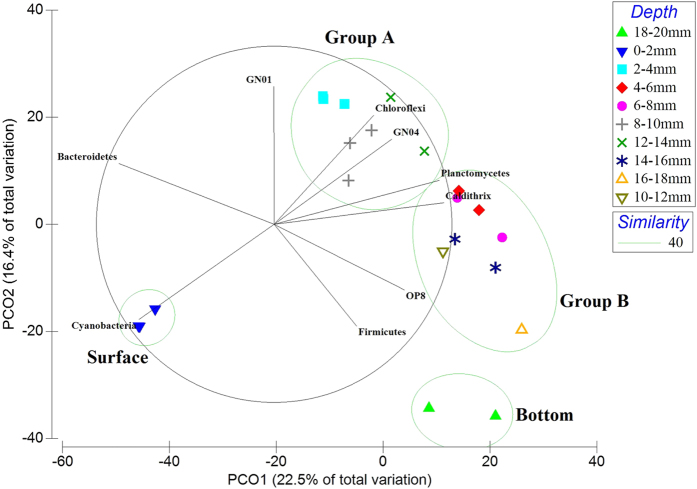
Figure 6. Principal coordinate analysis (PCoA) of Shark Bay smooth mat microbial commumity profiles from different depths.
Bray-Curtis similarity matrices of bacterial 16S rRNA gene sequence abundance derived from square-root treatment were used. The green circles represent cluster analysis, which groups layers that share 40% of phylogenetic similarity together at OTU level. PCoA clearly depicts four clustered formed within the smooth mats. The groups were designated surface, group A, group B and bottom. Bacterial phyla with strong correlation (Pearson’s p > 0.7) with respect to depth were overlaid on the PCO plot. Black lines indicate the direction of increased taxon abundance at phylum level, and the length indicates the degree of correlation of the taxa with community data. Cyanobacteria was most abundant at the surface layer, Bacteroidetes is correlated between the surface and group A, Chloroflexi and candidate phylum GN04 are stronlgy correlated to Group A, Planctomycetes showing strong relationship to Group B and Firmicutes linked to the bottom layer.

