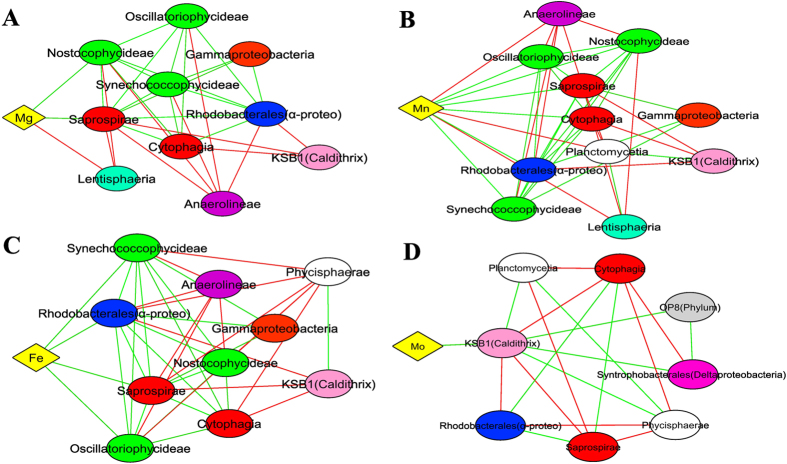
Figure 8. Network correlation analysis between elements (Mg, Mn, Fe and Mo) and bacteria in Shark Bay smooth mats.
(A) Magnesium. (B) Manganese. (C) Iron correlation. (D) Molybdenum. Connections are given for a strong (Pearson’s p > 0.6) and significant (p-value < 0.001) correlations. Each node represents a bacterial class or element. Alpha- and Deltaproteobacteria are presented at the order level. Green lines indicate positive correlations whilst red lines indicate negative correlations. The reoccurring bacterial taxa may indicate overlapped niches. Diamond shape indicates element whilst eclipse shapes represent bacteria. Different colours indicate elements and bacterial phyla. Yellow: element, Green: Cyanobacteria, Blue: Alphaproteobacteria Orange: Gammaproteobacteria, Pink: Deltaproteobacteria, Purple: Chloroflexi, White: Planctomycetes, Light pink: Caldithrix, Light blue: Lentisphaeria, Light grey: OP8.

