
Figure 4. The receiver operation characteristics (ROC) curve analyses.
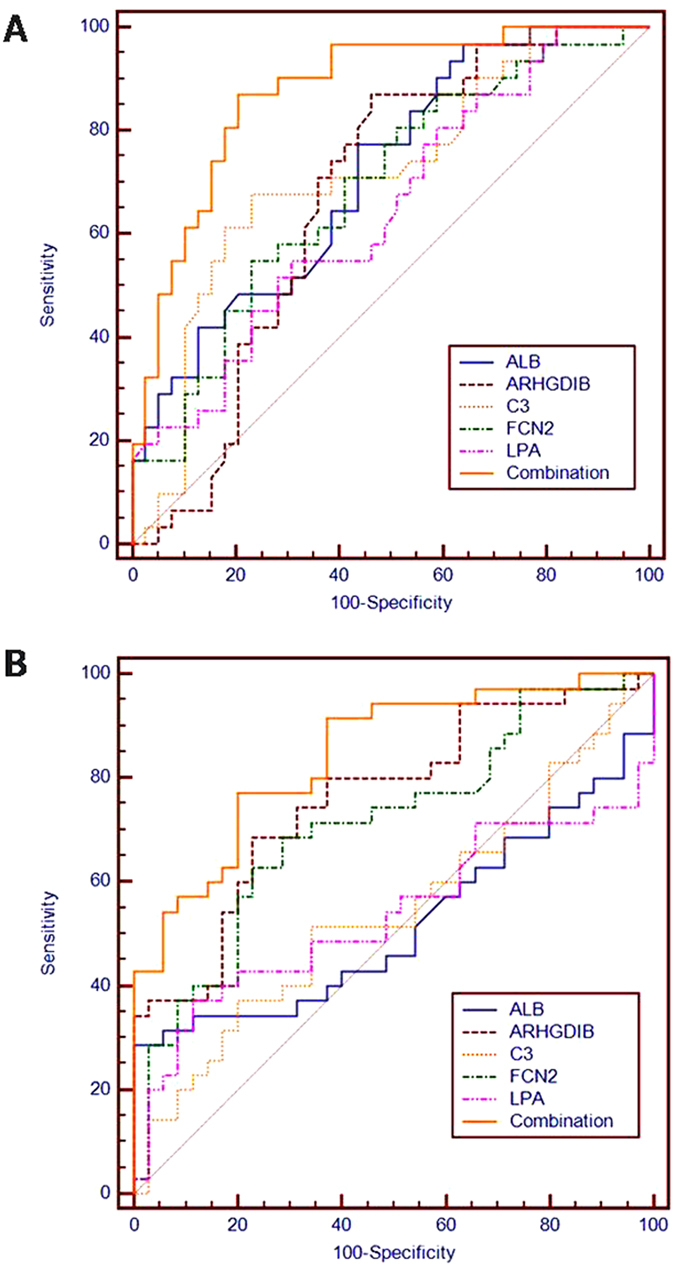
ROC curve analyses of the ALB, ARHGDIB, C3, FCN2, and LPA levels as well as the combination. (A) A model to discriminate cured tuberculosis patients from untreated tuberculosis patients. (B) A model to discriminate sputum-positive patients from sputum-negative patients.