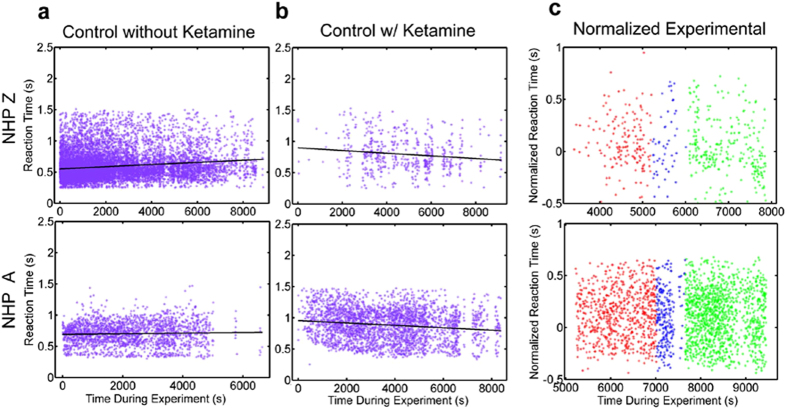
Figure 7. Raw Reaction Time Data.
Reaction times for individual trials as a function of time during the experiment. For (a) and (b) magenta dots indicate individual data points and the black line is the linear regression fit. (a) shows the control data collected on days when ketamine was not administered. (b) shows the control data collected on days when ketamine was administered to mimic the parameters used on experimental days. The regression fit for the ketamine control data was used to normalize the experimental data to remove the effects of ketamine on the behavioral results during experimental days. (c) shows the normalized experimental data. Red dots indicate trials completed before applying the FUS technique, blue indicates trials completed during the FUS technique and green indicates trials completed after applying the FUS technique.

