
Figure 8. Behavioral Results.
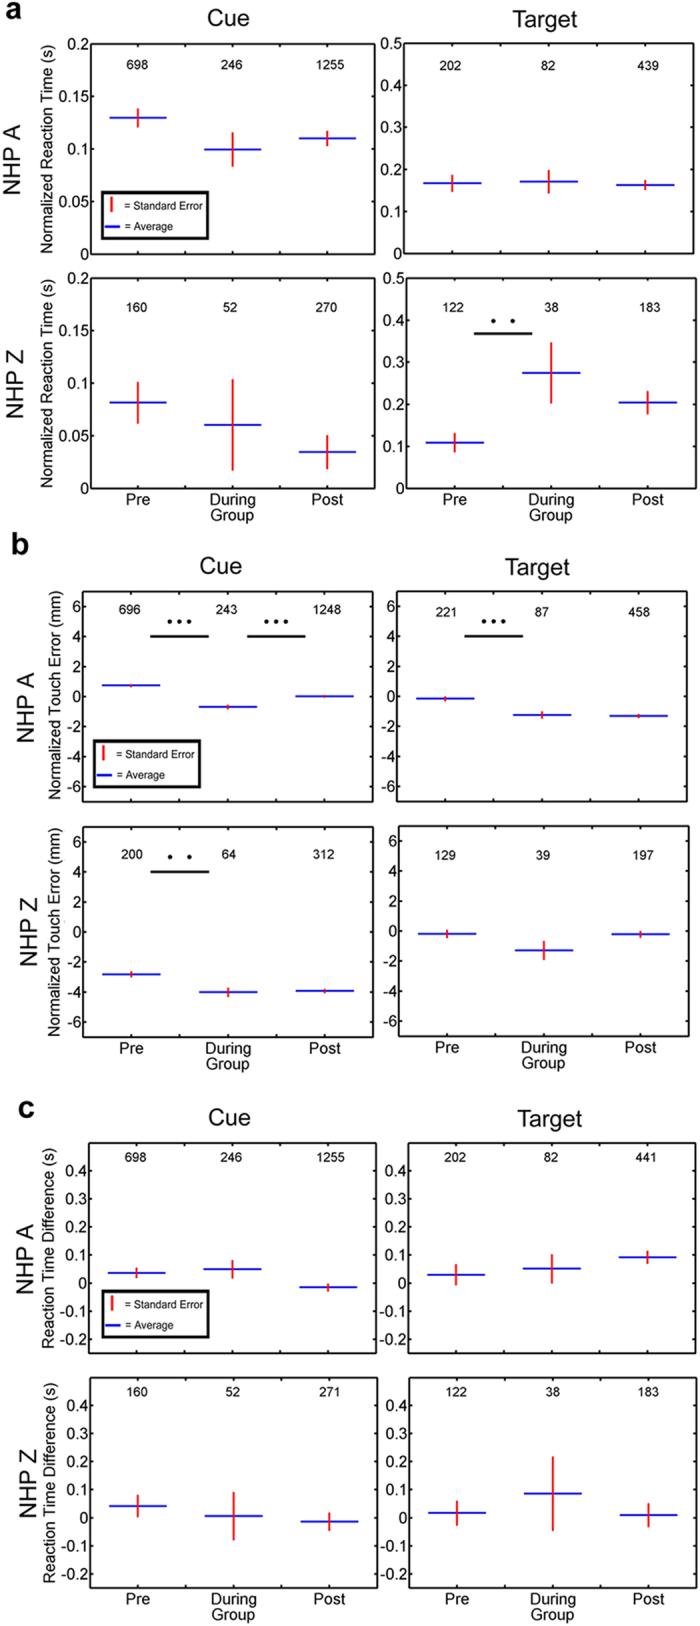
The responses to the behavioral task were measured in reaction time and touch error. The numbers at the top of the Figure indicate the n value (number of completed trials) for each group. (a) shows the average reaction time to the cue and target for each group (pre, during and post FUS procedure). The horizontal blue bar indicates the average reaction time for each group while the red vertical bar indicates the standard error. There is a small non-significant decrease across the groups for both NHP reacting to the cue (2-sided student’s t-test, p > 0.05). NHP A exhibits this decrease in reaction time across groups when responding to the target, but NHP Z shows a significant increase in reaction time to the target (2-sided student’s t-test, p = 0.013). (b) shows the average touch error for each group. Blue horizontal bars indicate the average touch error while red vertical bars indicate the standard error. For both NHP there was a significant decrease in touch error between the pre- and the during group in response to the cue (2-sided student’s t-test, p < 0.01). Only NHP A also exhibited a significant difference in touch error between the pre- and during groups to the target. (c) shows the difference in reaction time between the high and the low reward. Horizontal blue bars indicate the average difference in reaction time (high-low) while the red vertical bars indicate standard error.