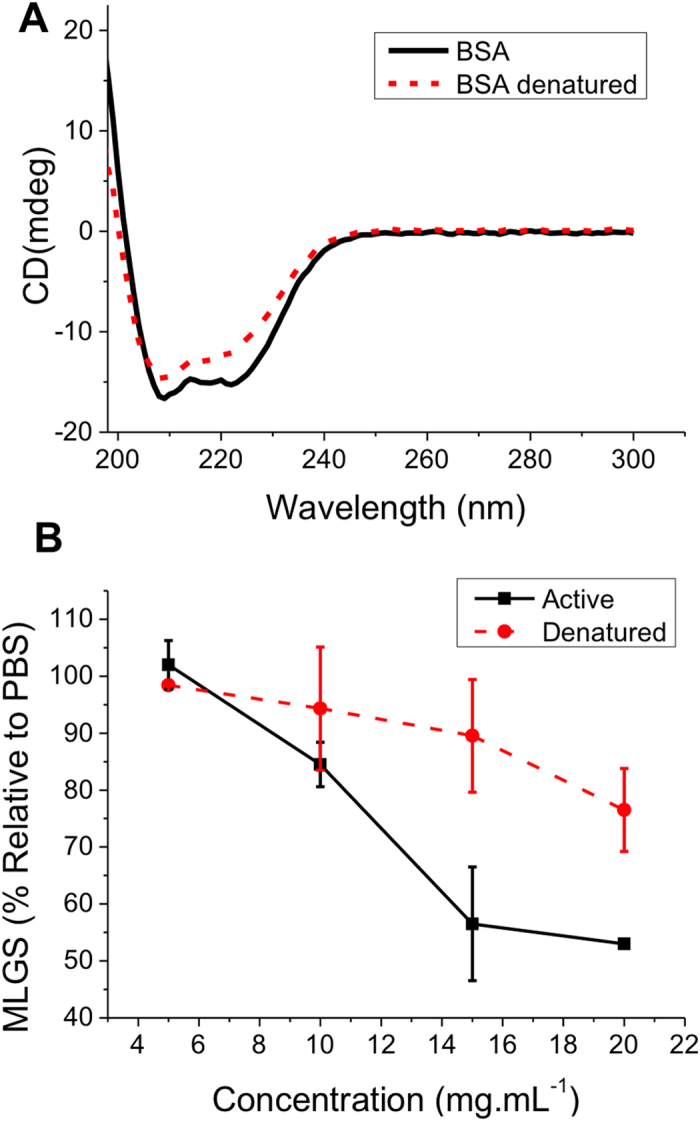
Figure 6. IRI activity of BSA.

(A) Circular dichroism spectra of BSA at 500 μg.mL−1 before and after heat-denaturation; (B) Comparison of active and denatured BSA. Error bars represent ± SD from a minimum of 3 repeats. MLGS = mean largest grain size relative to PBS control.
