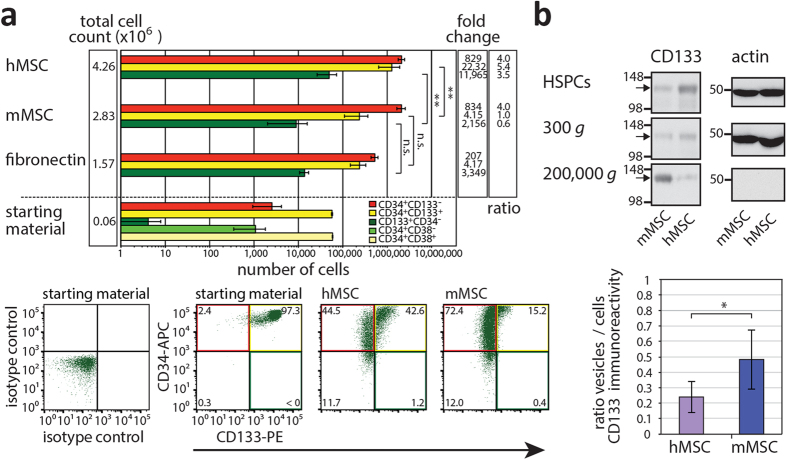
Figure 1. Expansion of human HSPCs cultured on murine or human MSCs and release of CD133+ membrane vesicles.
(a) CD34+ HSPCs (6 × 10⁴ cells) isolated from mobilized peripheral blood (starting material) were cultured for one week either on murine (m) or human (h) MSCs or fibronectin prior to their analysis by flow cytometry for CD34 and CD38 or CD133. Total cell count, number of cells harboring a given phenotype (as indicated) and their expansion are shown. Fold change between cultivation with m or hMSCs or without versus starting material is indicated. Ratio of HSPC expansion with and without feeder cell layer is shown. Mean and standard deviation from four independent experiments using four distinct donors of HSPCs and two m or hMSCs preparations are shown. Note the abscissa is at a logarithmic scale (top panel). Representative dot plots are displayed (bottom panels). In the starting material, most of hHSPCs are CD34+CD133+ while CD133+CD34– ones are very rare consistent with CD34 selection. The colored quadrants correspond to the cell phenotypes indicated in the upper panel. (b) After 7 days of HSPC–MSC co-culture, conditioned media were subjected to differential centrifugation for 5 min at 300 × g, 20 min at 1,200 × g, 30 min at 10,000 × g and 60 min at 200,000 × g. Adherent hematopoietic cells (HSPCs) were harvested, and centrifuged 5 min at 300 × g. All pellets were analyzed by immunoblotting for CD133 (arrow) and actin. Note that only half of the material was loaded for the HSPC fraction, and 1,200 and 10,000 × g fractions are not shown since no CD133 was detected therein. A representative experiment is displayed. The amount of CD133-immunoreactive material in each fraction was quantified, and ratios of vesicles (200,000 × g)/cells (HSPCs + 300 × g) are presented (mean ± standard deviation). Four independent experiments using distinct donors of HSPCs and MSC preparations were performed. Asterisks indicate a significant difference as calculated by two-tailed paired student’s t-test (*p < 0.05; **p < 0.01). N.s., not significant (p ≥ 0.05).

