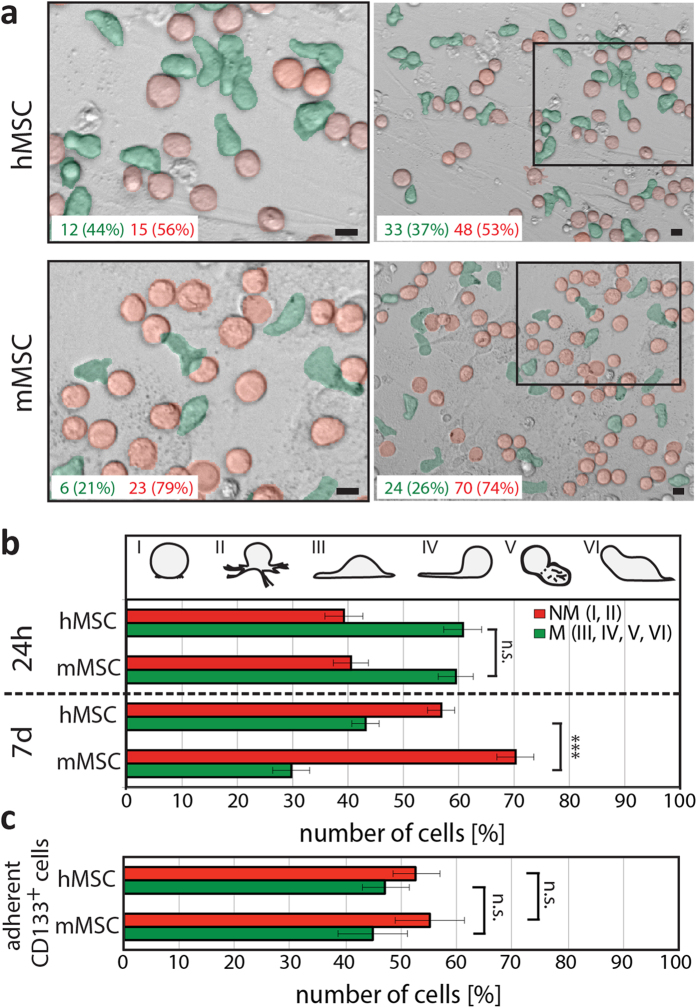
Figure 3. The relative amount of human HSPCs exhibiting a migrating morphology is reduced on murine MSCs in comparison to human ones.
(a) Phase contrast pictures of human (h) HSPCs growing on either h (top panels) or murine (m; bottom panels) MSCs for 7 days. The absolute amounts of migrating and non-migrating hematopoietic cells, which have an elongated (green) or spherical (red) morphology, respectively, observed in each frames are indicated. Left panels show higher magnification views of areas indicated in the corresponding images on the right. (b,c) Numbers of hematopoietic cells exhibiting morphologies characteristic of non-migrating (NM, red) and migrating (M, green) cells, respectively (see Fig. 2), were counted after 24 hours and 7 days of co-culture on MSCs (b). Numbers CD133+ hHSPCs with a given morphology after 7 days are indicated (c). Three to four experiments were performed using CD34+ hHSPCs isolated from different donors, and at least 400 (b) or 100–200 (c) cells were analyzed per condition. Three asterisks indicate a significant difference as calculated by two-tailed paired student’s t-test (p < 0.001). N.s., not significant (p ≥ 0.05). Scale bars: 10 μm.

