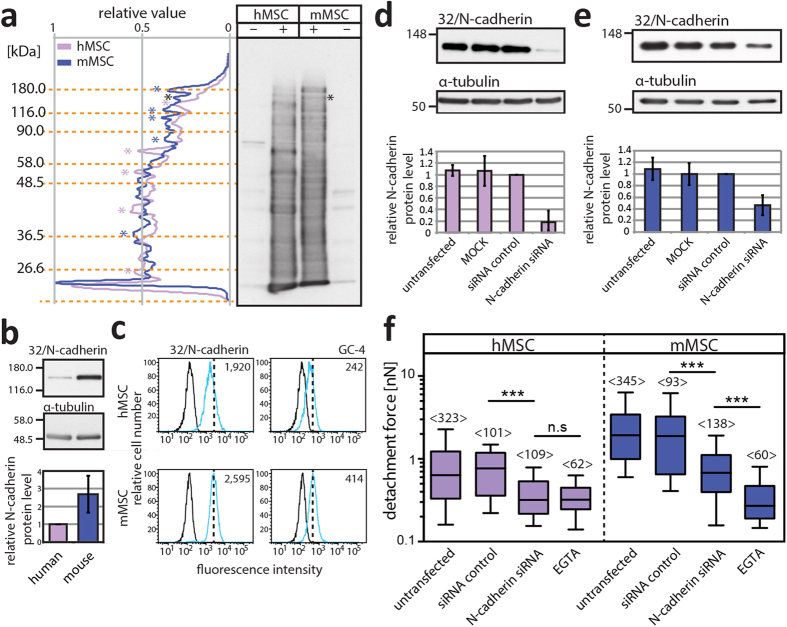
Figure 5. Mesenchymal cell-associated N-cadherin is the major player in the differential adhesion of human HSPCs.
(a) Human (h) or murine (m) MSCs were incubated without (–) or with (+) sulfo-NHS-LC-biotin prior to solubilization. Biotinylated proteins were detected using HRP-conjugated streptavidin. The purple and blue asterisks indicate the major cell surface proteins in h and mMSCs, respectively. The black ones indicate the potential N-cadherin signal. (b) Expression level of N-cadherin in h versus mMSCs. N-cadherin was detected by immunoblotting using 32/N-cadherin antibody and its expression was normalized to α-tubulin. Values are relative to that of hMSC (n = 5, MSCs were derived from three distinct donors or murine preparations). (c) Flow cytometry analysis of PFA-fixed, saponin-permeabilized cells labeled with two distinct N-cadherin antibodies (clones 32/N-cadherin and GC-4) followed by an anti-mouse DyLight®649-conjugated secondary antibody. The antigen expression (cyan) and the appropriate isotype control (black) are shown. The mean fluorescence intensity appears in the right-top corner. (d,e) Human (d) or m (e) MSCs were either untransfected or transfected without (MOCK) or with negative control or N-cadherin siRNAs. N-cadherin knockdown was confirmed 20 hours after transfection by immunoblotting, and its expression normalized to α-tubulin (n = 3). (f) Box-whisker plots show FD of freshly isolated CD34+ HSPC from h (purple) or m (blue) MSC measured 16–20 hours after transfection with a contact time of 60 sec. For comparison, the data obtained with untransfected MSCs and EGTA were presented (Fig. 4). For each transfection experiments (n = 3), CD34+ HSPCs were derived from distinct donors. Box-whisker plots represent half of the data points within the box and 80% within the whiskers. Horizontal lines within the box represent median values. Numbers within bars (<n>) show the total number of analyzed FD curves. The pairwise comparison of data was performed using Mann-Whitney-U-test (***p < 0.001; n.s., not significant, p ≥ 0.05).

