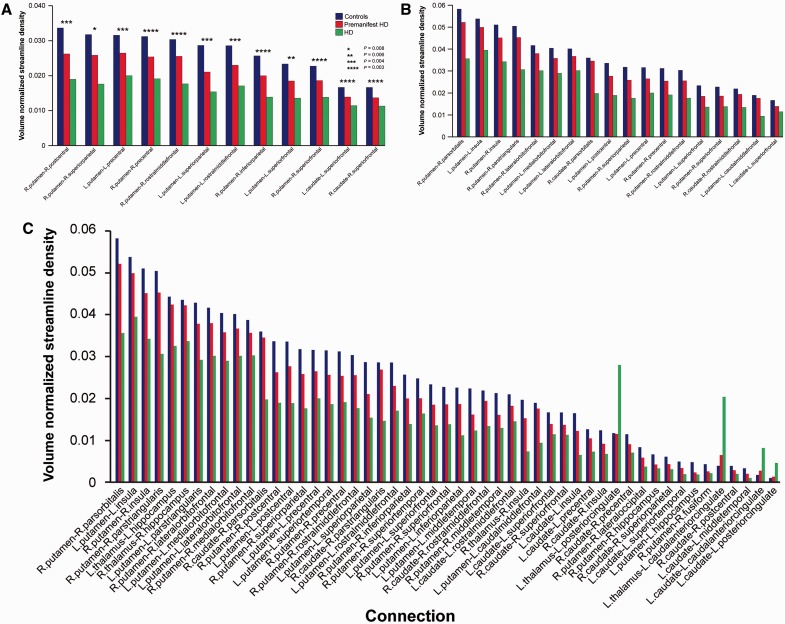
Figure 5.
Corticobasal ganglia connectivity univariate analysis. Group differences between (A) premanifest Huntington’s disease (HD) versus controls (*P = 0.008, **P = 0.006, ***P = 0.004, ****P = 0.003), (B) Huntington’s disease versus premanifest Huntington’s disease, and (C) Huntington’s disease versus controls. Only those connections with (A) P < 0.009, (B) and (C) P < 0.002 are displayed to highlight most significant connections. Data are represented as a group mean (confidence intervals are not included as not standard for permutation tests). Controls are shown in blue, left columns; premanifest Huntington’s disease is shown in red, centre columns; and Huntington’s disease is shown in green, right columns.

