
Figure 4. Statistics of aftershock sequences in the numerical model.
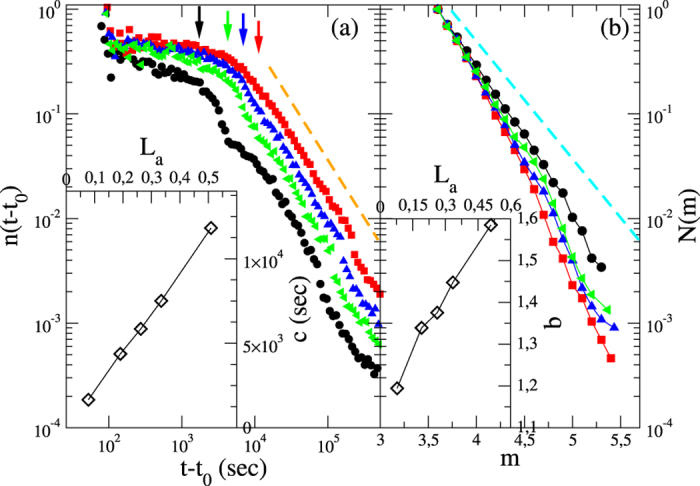
(Left panel) The temporal decay of the number of aftershocks after a mainshock with magnitude  in the numerical model. Different colors correspond to different values of the initial shear stress
  from right to left. Each curve is obtained by averaging over 10 different initial random configurations. Data exhibit different characteristic time scales c (indicated as coloured vertical arrows) for the onset of the power law decay for different Δ0. The orange dashed line indicates the Omori power law decay with an exponent p = 1.1. In the inset the parametric plot of c vs the size of the aftershock area La. (Right panel) The magnitude distribution for aftershocks following a mainshock with magnitude
  . We adopt the same colour code of the left panel. The cyan dashed line indicates the exponential decay
  obtained in the whole numerical catalog. In the inset the parametric plot of b vs the size of the aftershock area La.