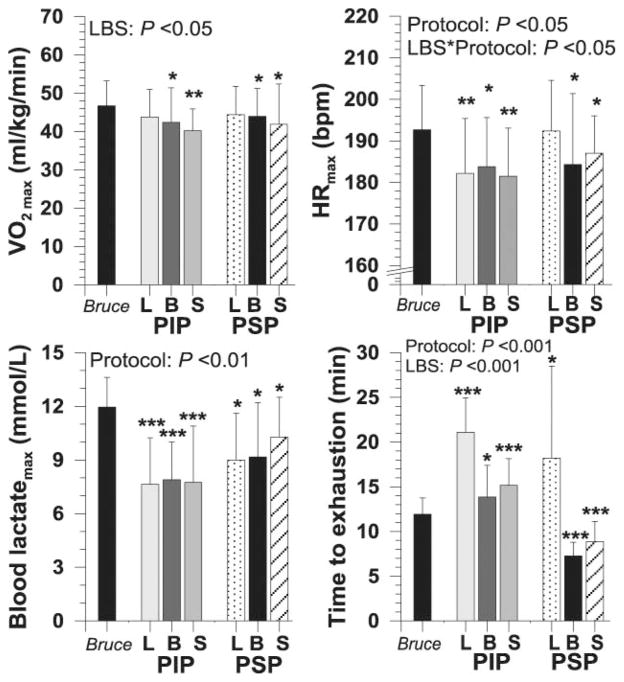
FIGURE 2.
Maximal oxygen uptake (VO2max), maximal heart rate (HRmax), maximal lactate concentration and time-to-exhaustion; L, B and S represent the conditions with light clothing (Light), PPE with rubber boots (Boots), and PPE with running shoes (Shoes), respectively. Note: *, **, and *** display significant differences compared with the Bruce protocol at levels of 0.05, 0.01, and 0.001, respectively.

