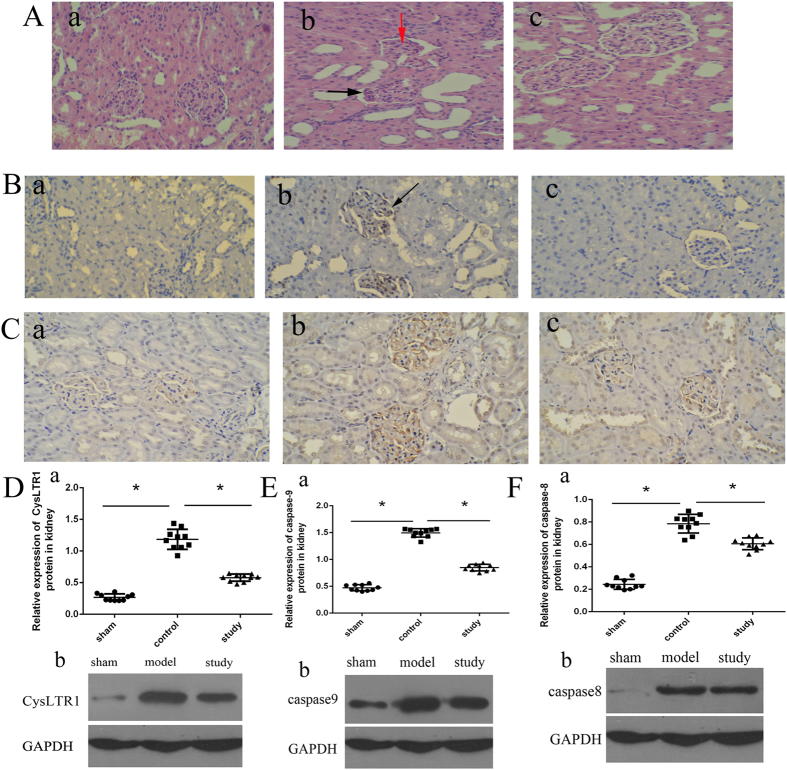
Figure 6. Montelukast reduces kidney injury after intestinal IRI.
Representative photomicrographs of kidneys from rats in different groups (A-a, sham group; A-b, control group; A-c, study group. H&E, 200× magnification). highlighting tubular simplification, hypereosinophilia and glomerular atrophy (A-b, down and red arrows). Expression of NGAL in renal tissues in different treatment groups ((B), B-a, sham group; B-b, control group; B-c, study group). CysLTR1 protein expression in the kidney from different treatment groups by immunohistochemistry and western blotting ((C,D). C-a, sham group; C-b, control group; C-c, study group). Protein expression of caspase-8 and caspase-9 in the kidney (E,F). *P < 0.05.

