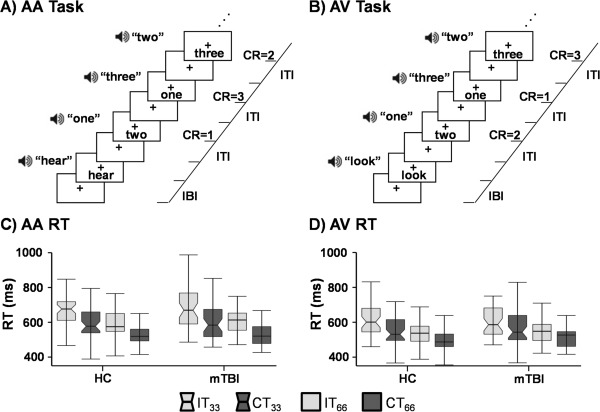
Figure 1.

Representations of incongruent trials for A) attend‐auditory (AA) and B) attend‐visual (AV) tasks as determined by the initial cue (AA = “hear”; AV = “look”). Expected correct responses (CR), inter‐trial interval (ITI) and inter‐block interval (IBI) are represented at the right of the timeline. The bottom row presents box‐and‐whisker plots for reaction times (RT) in AA (Panel C) and AV (Panel D). Data are presented separately for HC and mTBI, with incongruent (IT; light gray) and congruent (CT; dark gray) trials at the two stimulation frequencies (0.33 Hz = notched boxes; 0.66 Hz = un‐notched boxes) used in the experiment.
