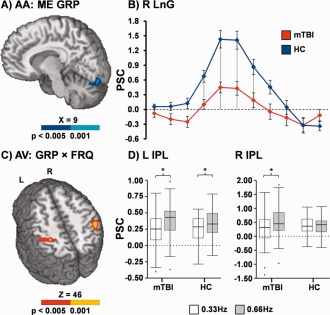
Figure 2.

Decreased activation (Panel A; blue coloring = P < 0.005; cyan = P < 0.001) within the right lingual gyrus (LnG) was observed for mild traumatic brain injury patients (mTBI; red trace) relative to healthy controls (HC; blue trace) during the attend‐auditory (AA) trials (main effect [ME] of group). Panel B plots the mean percent signal change (PSC) at each image post‐stimulus onset for both groups separately, representing the hemodynamic response function. The drop lines in Panel B indicate images that were used in between group comparisons. Panels C and D display the right and left inferior parietal lobule (IPL), which was associated with a significant interaction (red coloring = P < 0.005; yellow coloring = P < 0.001) between group (GRP) and stimulus frequency (FRQ) during attend‐visual (AV) trials. Box‐and‐whisker plots of the average PSC data are presented in Panel D, with asterisks denoting significant differences (P < 0.05) as a function of frequency (0.66 Hz [gray] > 0.33 Hz [white]). Slice locations are given according to the Talairach atlas in Panels A and C.
