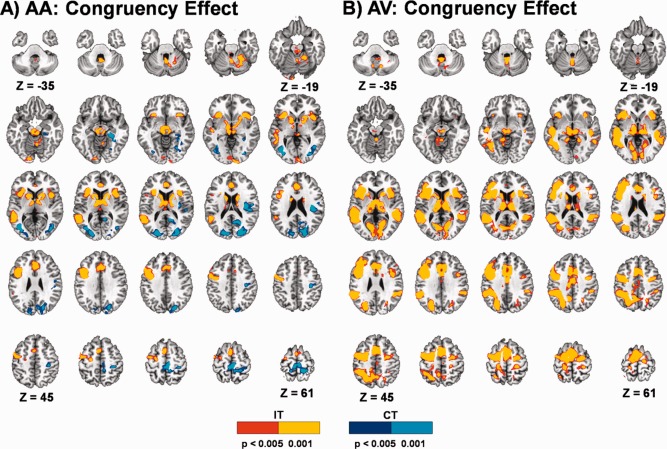
Figure 3.

This figure presents clusters with significant activation differences between incongruent (IT) and congruent (CT) trials in attend‐auditory (AA) and attend‐visual (AV) conditions collapsed across both groups of participants. Axial slices are displayed according to the Talairach atlas. Clusters are shown in red (P < 0.005) and yellow (P < 0.001) where activation is greater in incongruent relative to congruent trials and in blue (P < 0.005) and cyan (P < 0.001) where activation is greater in congruent relative to incongruent trials.
