
Fig. 3.
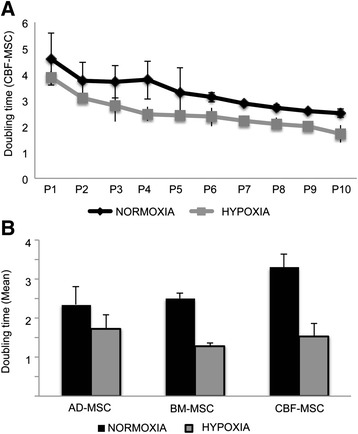
Cell proliferation in normoxic and hypoxic conditions. a Graph represents the doubling time in normoxic and hypoxic conditions during cell culture for AD-, BM-, and CBF-MSCs expressed as mean value between data obtained from P1 to P10. b Doubling time evaluated on CBF-MSCs at each passage in normoxic and hypoxic conditions. Asterisks represent statistically different doubling time means between normoxia and hypoxia, n = 3: *P < 0.05. AD-MSC adipose tissue mesenchymal stem cell, BM-MSC bone marrow mesenchymal stem cell, CBF-MSC cortical bone fragment mesenchymal stem cells, P passage