
Fig. 9.
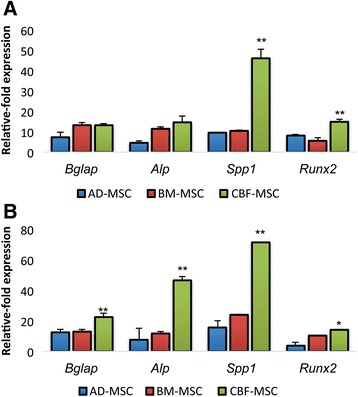
Quantitative polymerase chain reaction analysis for the expression of the osteogenic markers (Bglap, Ssp1, Alp, and Runx2) for AD-, BM-, and CBF-MSCs at 4 weeks of induction in normoxic (a) and hypoxic (b) conditions. Data are represented as fold-change compared with the expression levels found in the uninduced cells, respectively. Values are mean ± standard deviation (n = 3). Asterisks depict significant (P < 0.05) and highly significant (P < 0.01) differences between CBF-MSCs and AD- or BM-MSCs. AD-MSC adipose tissue mesenchymal stem cell, BM-MSC bone marrow mesenchymal stem cell, CBF-MSC cortical bone fragment